ChartDataView: PP.Exp.Ui.EaxChartView;
The ChartDataView property specifies the chart whose settings will be edited from ribbon.
To execute the example, the page must contain the WorkbookBox component named workbookBox (see Example of Creating the WorkbookBox Component), and also add the following code in the handler, that processes document opening event:
//Get the Ribbon component
var ribbonView = workbookBox.getRibbonView();
var chartDataViewButt = new PP.Ui.Button({
ParentNode: document.body, //DOM parent node
Content: "Change Chart", //Text
Click: PP.Delegate(onClickChartDataView)
});
	function onClickChartDataView()
{
//Get time series build object
var chartDataView = ribbonView.getChartDataView();
//Set time series width
chartDataView.setWidth(500);
}
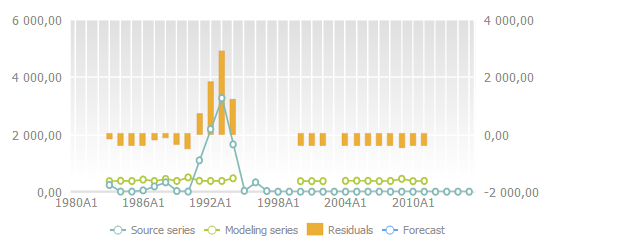
After executing the example clicking the Edit Chart button creates the following chart based on the obtained time series object:
See also: