PP.MapBarAxis(settings: Object);
settings. JSON object that contains values of class properties.
The MapBarAxis constructor creates an instance of the MapBarAxis class.
To execute the example the HTML page must contain the MapChart component named map (see Example of Creating the MapChart Component). Create a bar factor for a map layer area with the RU-KYA identifier containing axis and showing data only for the first time period:
// Return a layer with map areas
function getWorkLayer() {
    return map.getLayer("Regions");
}
// Return current dimension selection for the map axis
function getSelectedIndex() {
    return 2;
}
// Return a base class of the map bar factor
function getBarVisual() {
    return map.getVisuals().barVisual0;
}
// Return the map layer area with selected identifier
function getShape(shapeId) {
    var shape = getWorkLayer().getParentLayer().getShape(shapeId);
    map.setBarHoverness(shape);
    return shape;
}
// Return settings of data mapping to the height of visualizer items
function getHeightMapping() {
    return getBarVisual().getHeightMappings()[0];
}
// Define settings of data mapping
function setupHeightMapping() {
    getHeightMapping().setType(PP.DataMappingType.Transformer);
    var dataTransformer = new PP.CoordinateTransformer({
        IncludeZero: true,
        UseSignDivision: true,
    });
    dataTransformer.getValue = function getValue(data) {
        if (!this.getUseSignDivision()) {
            return this.getValue(data);
        } else {
            // Double input values
            return data * 2;
        }
    }
    getHeightMapping().setDataTransformer(dataTransformer);
}
// Create an axis for bar factor
function createBarAxis() {
    var barAxis = new PP.MapBarAxis({
        Pen: new PP.Pen({
            Color: PP.Color.Colors.black, // Tick mark color
            Style: PP.PenStyle.Dashed, // Style of the tick mark line
            Width: 4 // Tick mark width
        }),
        Visibility: PP.Ui.Visibility.Hidden
    });
    // Prepare the axis for drawing
    barAxis.prepareToRender(map.getBarLayer());
    return barAxis;
}
// Hide the axis for the bar factor
function hideAxis(mapBar) {
    mapBar.getAxis().setVisibility(PP.Ui.Visibility.Hidden);
    mapBar.refresh();
}
// Show the axis for the bar factor
function showAxis(mapBar) {
    mapBar.getAxis().setVisibility(PP.Ui.Visibility.Visible);
    mapBar.refresh();
}
// Create a bar factor
function createMapBar() {
    // Create a bar factor
    var mapBar = new PP.MapBar({
        Axis: createBarAxis(), // Axis for Bar view
        AllPeriod: false,
        Chart: map,
        Shape: getShape("RU-KYA"), // Map layer area for which factor is created
        BorderThickness: 0.5, // Column border width
        Visual: getBarVisual(),
        // Column width with a minimum value
        LeastWidthPart: getHeightMapping().getDataTransformer().getValue(2.5),
        // Column height with a minimum value
        LeastHeightPart: getHeightMapping().getDataTransformer().getValue(17.5),
        IsPercentage: true
    });
    mapBar.refresh = function () {
        this.getChart().draw();
    }
    return mapBar;
}
// Render a bar factor
function drawMapBar(mapBar) {
    mapBar.setSelectedIndex(getSelectedIndex());
    mapBar.getLayer().getMapBarCollection().push(mapBar);
    // Re-render a map
    mapBar.refresh();
}
// Define settings of data mapping
setupHeightMapping();
// Create a bar factor
var mapBar = createMapBar();
// Render this factor
drawMapBar(mapBar);
// Show the factor
showAxis(mapBar);
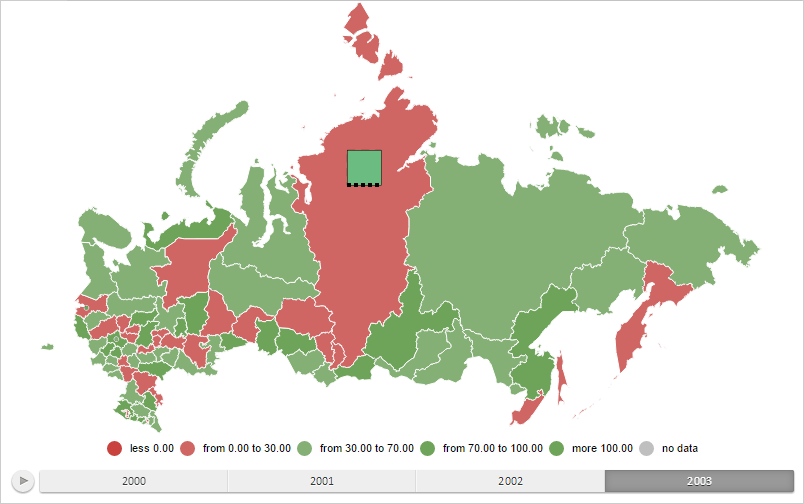
After executing the example, the bar factor for the map layer area with the RU-KYA identifier containing axis and showing data only for the first time period is created:
See also: