add(id: String, timeAxis: PP.TimeAxis, dimAttrId: String);
id. Series identifier.
timeAxis. Time axis to be added.
dimAttrId. Attribute identifier (if attributes are configured).
The add method adds data for a specified series attribute.
To execute the example, the HTML page must contain the BubbleChart component named bubbleChart (see Example of Creating the BubbleChart Component). Get a data source and add a new time axis to this source:
// Get data source
var dataSource = bubbleChart.getDataSources().ds0;
// Create and add a new time axis
var tAxis = new PP.TimeAxis({
    Items: ["150000", "180000", "220000", "250000", "280000", "320000", "34000"]
});
dataSource.add("Serie0_Point0", tAxis, "DimX");
// Refresh chart
bubbleChart.refresh();
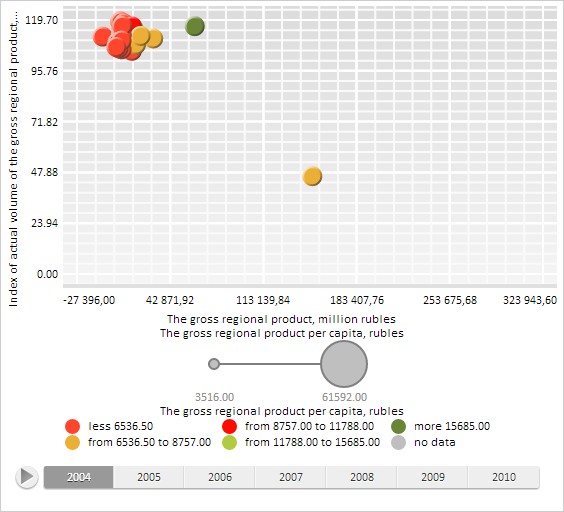
After executing the example a new time axis is created and set:
See also: