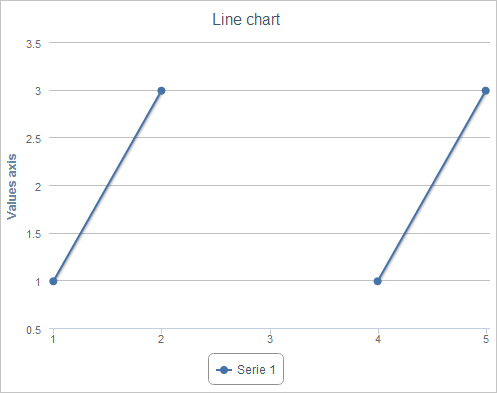
HighCharts now enable the user to connect only neighbor points with continuous line.
To enable this option, use the gapsAsNulls attribute of the series item.
If a missing value stands between two data points, when the gapsAsNulls attribute equals to true, the line between these points is not drawn. Otherwise it is drawn.
To execute the example, create an HTML page and perform the following operations:
1. Add links to the following libraries: PP.js, jquery.js and highcharts.src.js.
2. Within the <body> tag place a block with the "container" identifier:
<div id="container"></div>
3. Next within the <body> tag add a script that places a line chart on the page. Only neighbor points in this chart are connected with a solid line:
<script type="text/javascript">
$(function () {
    highChart = new Highcharts.Chart({
        chart: {
            renderTo: 'container',
            defaultSeriesType: 'line',
            zoomType: 'none'
        },
        title: {
            text: 'Line chart'
        },
        yAxis: {
            title: {
                text: "Value axis"
            }
        },
        // Determine data series
        series: [{
            name: 'Series 1',
            data: [{
                x: 1,
                y: 1
            }, {
                x: 2,
                y: 3
            }, {
                x: 4,
                y: 1
            }, {
                x: 5,
                y: 3
            }],
            gapsAsNulls: true // Connect only neighboring points
        }]
    });
});
</script>
After executing the example, a line chart is placed on the HTML page, and only neighbor points are connected with a continuous line in this chart:

See also:
The HighCharts Chart Allocation on HTML Page | series Element | HighCharts Improvements | Examples