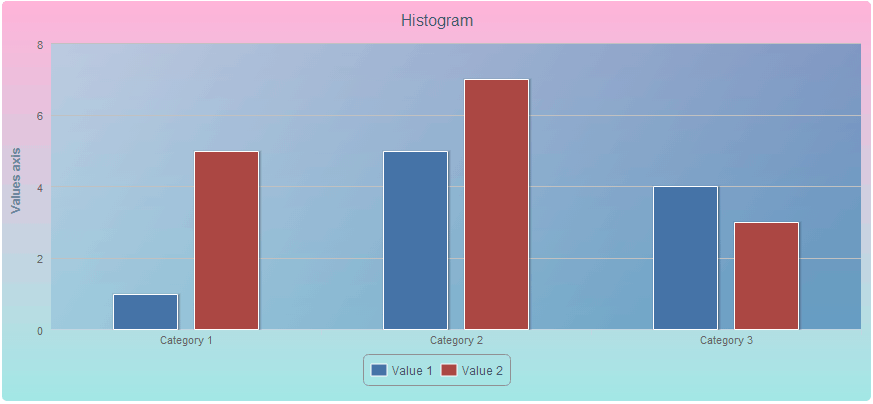
HighCharts charts enable the user to set angle and transparency for the linear gradient selected as the chart background or chart plot area background.
To execute the example, create a chart as shown on the The Highcharts Chart Allocation on HTML Page page. Add the following settings to the chart attribute:
                backgroundColor: {
                    linearGradient: {
                        angle: 90,
                        opacity: 0.5
                    },
                    stops: [
                        [0, 'rgb(255, 105, 180)'],
                        [1, 'rgb(72, 209, 204)']
                    ]
                },
                plotBackgroundColor: {
                    linearGradient: {
                        angle: 30,
                        opacity: 0.7
                    },
                    stops: [
                        [0, 'rgb(173, 216, 230)'],
                        [1, 'rgb(70, 130, 180)']
                    ]
                }
After executing the example linear gradient fill is applied to the chart and the chart plot area, with the gradient angle 90 and 30 degrees respectively:

See also: