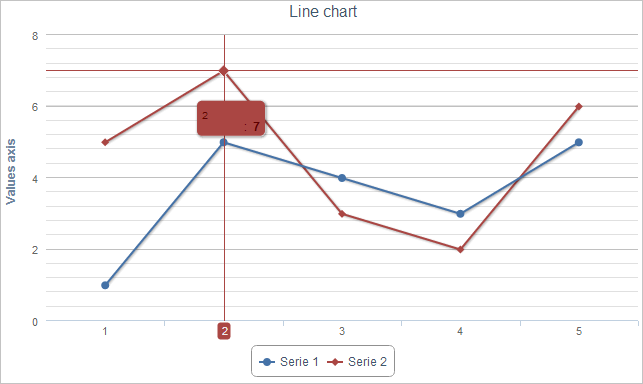
A possibility to show axes values for selected point is added for HighCharts.
Use the showLabel attribute of the crosshairs element to enable this option.
The showLabel attribute for the crosshairs element is used twice. The first use corresponds to the point value at the X axis, the second one to the value at the Y axis. If the attribute value is true the corresponding line is shown, otherwise it is not.
To execute the example, create an HTML page and perform the following operations:
1. Add links to the following libraries: PP.js, jquery.js and highcharts.src.js.
2. Within the <body> tag place a block with the "container" identifier:
<div id="container"></div>
3. Then within the <body> tag add a script that places a line chart on the page. This chart must allow showing X axis value for a selected point and have a tooltip that follows the mouse pointer:
<script type="text/javascript">
$(function () {
    highChart = new Highcharts.Chart({
        chart: {
            renderTo: 'container',
            defaultSeriesType: 'line',
            zoomType: 'none',
            seriesAsRings: true
        },
        title: {
            text: 'Line chart'
        },
        editmode: {
            state: false
        },
        xAxis: {
            categories: ['1',
                '2',
                '3', '4', '5'
            ]
        },
        yAxis: {
            title: {
                text: "Y axis"
            }
        },
        // Determine data series
        series: [{
            name: 'Series 1',
            data: [1,
                5,
                4,
                3,
                5
            ],
            allowedit: true
        }, {
            name: 'Series 2',
            data: [5, 7, 3, 2, 6]
        }],
        tooltip: {
            crosshairs: [{
                showLabel: true // Show value of the point in the X axis
            }, {
                showLabel: false // Hide value of the point in the Y axis
            }],
            clearMoving: true // Let the tooltip follow mouse pointer
        }
    });
});
</script>
After executing the example the HTML page contains a line chart that shows X axis value for the selected point and has a tooltip that follows the mouse pointer.
If you hover the pointer over the top left point, the chart changes to the following:

See also:
The HighCharts Chart Allocation on HTML Page | tooltip Element | HighCharts Improvements | Examples