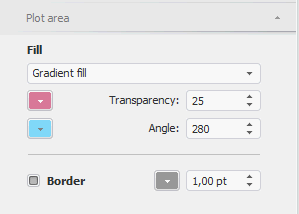
Bubble chart plot area can be set up on the Plot Area side panel tab in the Format group. This tab is available if a bubble chart is active:

The tab enables the user to set up borders and fill of bubble chart plot area:
Fill. In the drop-down list select the fill method:
§ None. No fill.
§ Solid Fill. Solid fill of the plot area is used. Select color in the drop-down palette. In the Transparency value editor set the transparency value for the fill.
§ Gradient Fill. Select the start and end colors of the gradient in the drop-down palettes. In the Transparency and the Angle value editors set fill transparency and gradient angle values.
See also: