Scale orientation enables the user to swap category and value axes.
To set up chart scale orientation, select chart orientation option in the Chart Type dialog box.
TIP. To quickly set up chart scale orientation, use the Chart side panel tab.
NOTE. Chart scale orientation can be set up in the Chart Type dialog box only in the desktop application for any type of chart except for pie chart, doughnut chart, radar chart, secondary histogram and secondary pie chart.
Two types of scale orientation are available for lines and charts:
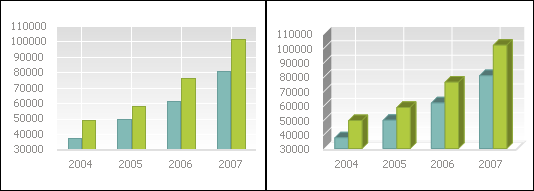
Left to right. When the scale is oriented from left to right, a chart is plotted by points from left to right. See below examples of histograms oriented from left to right (regular and 3D):
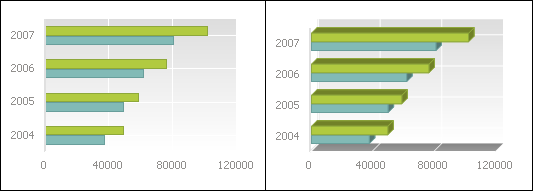
Bottom to top. When the scale is oriented from bottom to top, a chart is plotted by points from bottom to top. See below an example of a histogram oriented from bottom to top (regular and 3D):
See also:
Setting Up General Chart Parameters | Setting Up Chart Components