A data series point is a specific data series value that shows a value in the data array, that is used as a base for a data series.
To set up data series point formatting parameters, use:
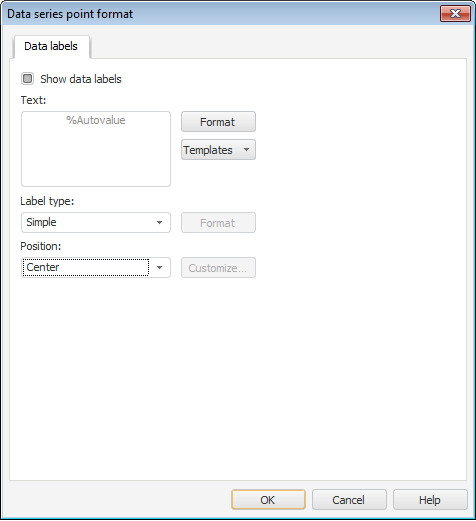
The Data Series Point Format dialog box for all chart types, except for waterfall charts.
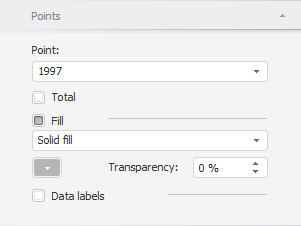
The Points tab on the side panel for waterfall charts.
Depending on the chart type, the following settings are available in the Data Series Point Format dialog box:
The following point settings are available on the tab:
Setting up point. To set up a specific point, select it in the Point drop-down list at the beginning of the tab. Select the Total checkbox to assign the point as a total. One or several points can be set as a total.
NOTE. The Total checkbox is also available in the active point's context menu.
Setting up fill. To display fill for specific point, select the Fill checkbox, select fill type in the drop-down list:
Solid Fill. Monochrome fill. The type is set by default. The color corresponds to color scheme. If required, specify fill transparency percent in the Transparency box.
Gradient Fill. Two-color gradient fill. To select gradient basic color, use a drop-down palette. If required, specify slope angle and transparency percent for the gradient in the Angle and Transparency boxes. To select the end color, first, select the Gradient Fill type on the Data Series tab, then select the required color in the drop-down palette.
NOTE. Firstly, specify the end color.
Heterogeneous Fill. Linear gradient fill. If required, specify fill transparency percent in the Transparency box. The basic gradient color corresponds to series color in color scheme.
NOTE. If color scheme changes, point fill changed to solid one. If data series fill type changes, point fill changes to identical one.
Series point formatting is similar to data series setup.
See also:
Data Series | Setting Up General Chart Parameters | Setting Up Chart Components