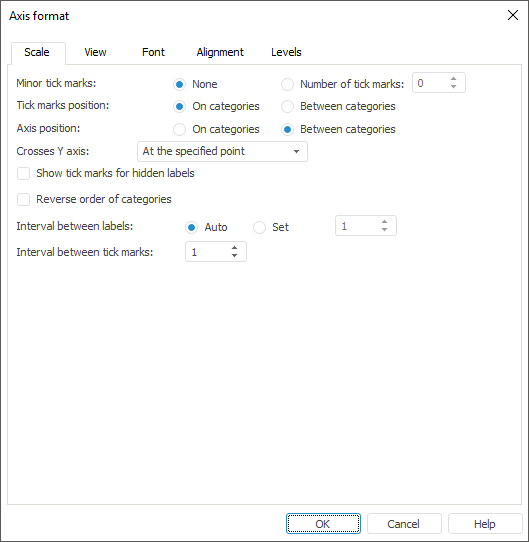
 To open the Axis Format dialog box
Select the chart axis and select the Axis Format item in the chart axis's context menu.
NOTE. In the Dashboards tool select the Chart > Axis Format item in the axis's context menu.
Double-click the caption of the selected axis.
To set up chart axes parameters in the regular report, select a chart axis. In the drop-down list Select a Chart Element for Formatting on the Chart ribbon tab choose the X Axis, Y Axis or Secondary Y Axis option and click the Fragment Style button. The Axis Format dialog box opens.
