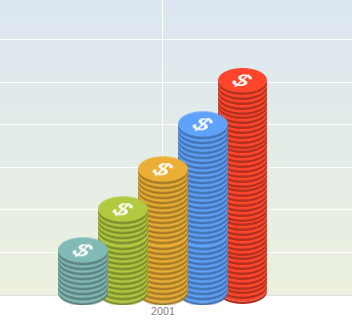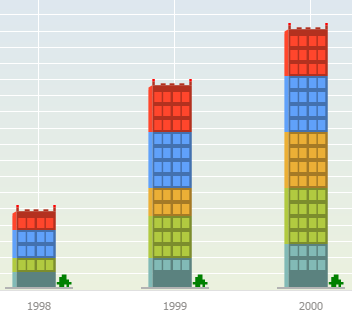

In the Foresight Analytics Platform web application, web application developers can use custom chart templates.
Custom templates change the form of all chart data series by means of the template in the svg format. Templates are available for histograms and pie charts.
Example of using a chart custom template:


To connect built-in templates to the web application as a plugin, add the following code inside the <pp> tag in the PP.xml file:
<plugins>
  <plugin name="ChartTemplates" path="../build/ChartTemplates.js">
  </plugin>
</plugins>
After settings are determined, restart the web application and select the chart custom template by clicking the ![]() Styles button on the Chart ribbon tab.
Styles button on the Chart ribbon tab.
The file with connection settings for templates ChartTemplates.js is installed into the web application along with the set of basic templates. Basic templates are installed into the Build\img\ChartTemplates\ folder.
Template files must correspond to certain structure and consist of standard SVG markup and additional attributes of Foresight Analytics Platform.
See also: