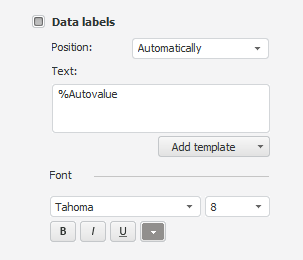
Data labels contain information on series or specific data points and make the chart easier to understand. Depending on the information to be selected in the chart, the user can add data labels for:
All chart series.
A single series.
Specific data point.
Level line.
See below examples of various types of charts with data labels:

The following approaches are used when setting up data labels:
To set up data labels of points in the particular chart data series, use the Data Labels group on the Data Series side panel tab.

To display data labels, select the Data Labels checkbox and determine the following settings:
TIP. To set up data labels for all series at once, use the Data Labels side panel tab. The tab appearance is the same as of the Data Labels group on the Data Series side panel tab. To display the Data Labels tab: make sure that side panel is displayed, select the chart in the working area, select the Format radio button on the side panel, go to the Data Labels tab and select the checkbox in the tab name.
To set up level line labels, use the Labels group on the Level Lines side panel tab.

The following operations are available to set up a label:
See also:
Setting Up Data Labels | Setting Up General Chart Parameters | Setting Up Chart Components