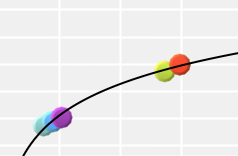
A trend line enables the user to display tendencies in the visual form. Such type of analysis is named regression analysis. Regression analysis can be used to extend the trend line in a bubble chart beyond the borders of actual data to predict future values.
By default, a trend line is not displayed. To set up visibility and parameters of tooltips, select the checkbox in the title of the Trend Line tab on the side panel.
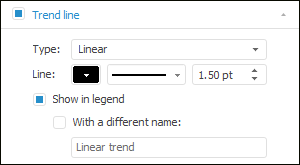
After the Trend Line checkbox is selected, the following settings are available:
See also:

 To display the tab