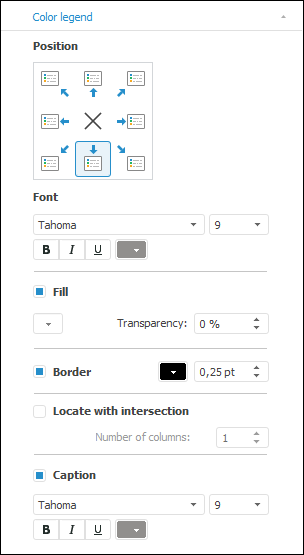
 To display the tab
Color or size legends of a bubble chart are set up on the Color Legend and the Size Legend side panel tabs.
Make sure that the side panel is displayed.
Select a bubble chart in the working area.
Select the Format radio button on the side panel and go to the Color Legend or the Size Legend tab.

The following settings of bubble chart legend are available on the tab:
Select required legend layout option in the Layout group of elements:
![]() . The upper left corner.
. The upper left corner.
![]() . The center of the upper border.
. The center of the upper border.
![]() . The upper right corner.
. The upper right corner.
![]() . The right border center.
. The right border center.
![]() . The lower right corner.
. The lower right corner.
![]() . The lower border center.
. The lower border center.
![]() . The lower left corner.
. The lower left corner.
![]() . The left border center.
. The left border center.
![]() . The legend is not displayed.
. The legend is not displayed.
By default, the legend is positioned at the lower border center of the bubble chart.
Set up parameters of the font used in the legend:
Font type. Use the drop-down list to select one of the fonts available in the operating system.
Size. Use the drop-down list to select font size or enter the custom size using the keyboard.
Font style. Click the buttons that determine font style:
B. Bold.
I. Italic.
U. Underlined.
When the button is pressed, the corresponding font style is used.
Font color. Select font color in the drop-down palette. To determine a new font color, click the Range button in the standard color palette and select the color in the extended color palette.
To display the legend fil, select the Fill checkbox. Determine the solid background fill in the drop-down palette and determine the fill transparency percent in the Transparency box.
To show a legend border, select the Border checkbox. Specify border line color and width in the appropriate boxes.
Select the Locate with Intersection checkbox to position the legend with intersection of bubble chart plot area. After the checkbox is selected, specify the number of columns in the legend.
NOTE. The setting is available only for a color legend.
If the checkbox is selected, the bubble chart is not intersected with the legend, the number of columns in the legend is determined automatically.
A legend caption is name of a facts dimension element, which is used to plot a bubble chart.
To display a legend caption, select the Caption checkbox. Select font and font size in the drop-down lists, specify font style and font color.
NOTE. In the web application the caption is displayed as a hyperlink, which when clicked opens the tab with the facts dimension, the element of which is selected.
See also: