 To display the tab
Tool interfaces in the web application and in the desktop application are identical, and differences in functionality are given in appropiate commments.
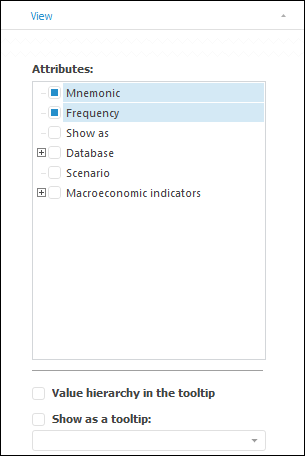
To select attributes with values displayed on the workbook sheet along with data, use the Attributes group on the View side panel tab.
The tab contains the list of all time series attributes, which values can be displayed. If the attribute is a reference to the dictionary, the attributes of this dictionary are listed as the child elements. The Show As and the Database elements are not attributes and are used to manage the view of details about time series.
Example of a tab:

To set up additional data displayed on the table, use the Attributes list. The following view is available:
Attribute value. Select the checkbox, corresponding to the attribute. A column to display the values of the selected attribute is added to the data table.
By default, only the Name attribute is displayed. If the additional attributes are not displayed, the Name attribute checkbox is not available for deselecting.
Series transformation name. Select the Show As checkbox. The View Format column is added to the data table to display the name of the transformation applied to the data series.
Series data source. Select the:
Database. The Database column is added to the data table to display the name of the time series data source.
Database > Path. The Path column containing path to the time series data source is added to the data table.
For example, here is a data table with columns, which display information about time series data source:

To set up the time series tooltip, use the following checkboxes:
Value Hierarchy in the Tooltip. By default, the checkbox is deselected. If the checkbox is selected, the full values hierarchy is displayed in the tooltip for the displayed attributes. For example:

Show as a Tooltip. By default, the checkbox is deselected. If the checkbox is selected, the value of the specified observation attribute is displayed in the tooltip for time series observations. To select the attribute, use the drop-down list located below. If the value of the specified attribute is set, the red corner is displayed for series observation in the cell corner, and the tooltip is available.
See also: