 Rotate Rows/Columns button on the Chart ribbon tab. As a result series will be generated from data in columns.
In the Analytical Queries (OLAP), Dashboards, Reports and Time Series Analysis tools one can change data transfer method to the chart.
By default data is sent by rows and series are generated from data in rows.
To transfer data to the chart by columns, click the Rotate Rows/Columns button on the Chart ribbon tab. As a result series will be generated from data in columns.
To return to data transfer by rows, click the Rotate Rows/Columns button one more time.
There is a data table by which a chart is plot:
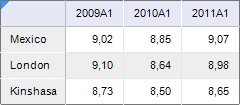
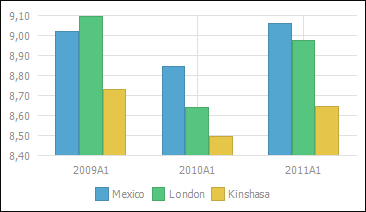
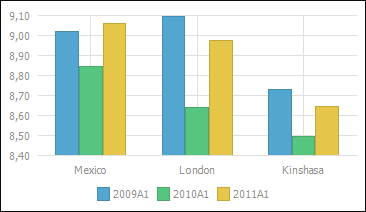
The left chart shows default behavior: data is sent by rows. The right chart sends data by columns:
See also: