
Normalizing of displayed data is available in the Analytical Queries (OLAP), Dashboards, and Time Series Analysis tools and is used to estimate series norm.
After normalizing is applied, series data is displayed as normalized values on the chart.
Normalized value of the X series member is calculated by the following formula:
Where:
D. Sample variance.
To normalize data, click the  Normalization button on the Chart ribbon tab. The chart will be rebuilt.
To display source data, release the Normalization button.
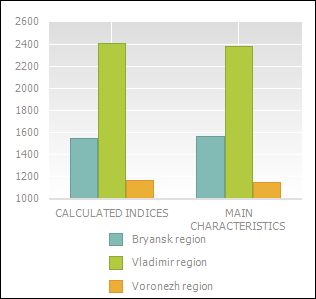
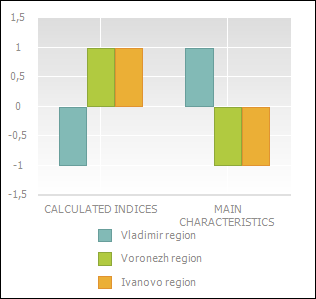
The chart appearance before (left) and (right) data normalizing:
See also: