This section shows examples of charts that can be built using capabilities of the Reports tool:
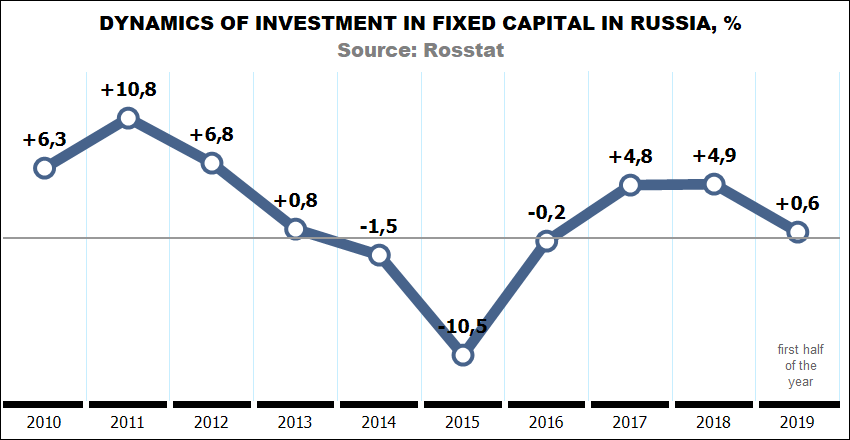
The Investment Dynamics chart:
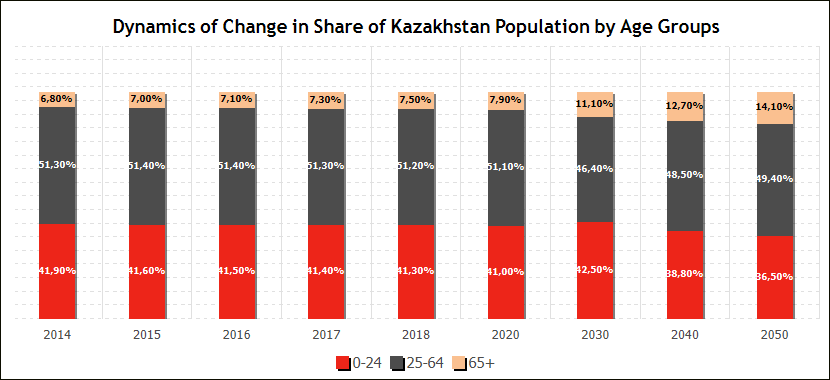
The Demographic Situation chart:
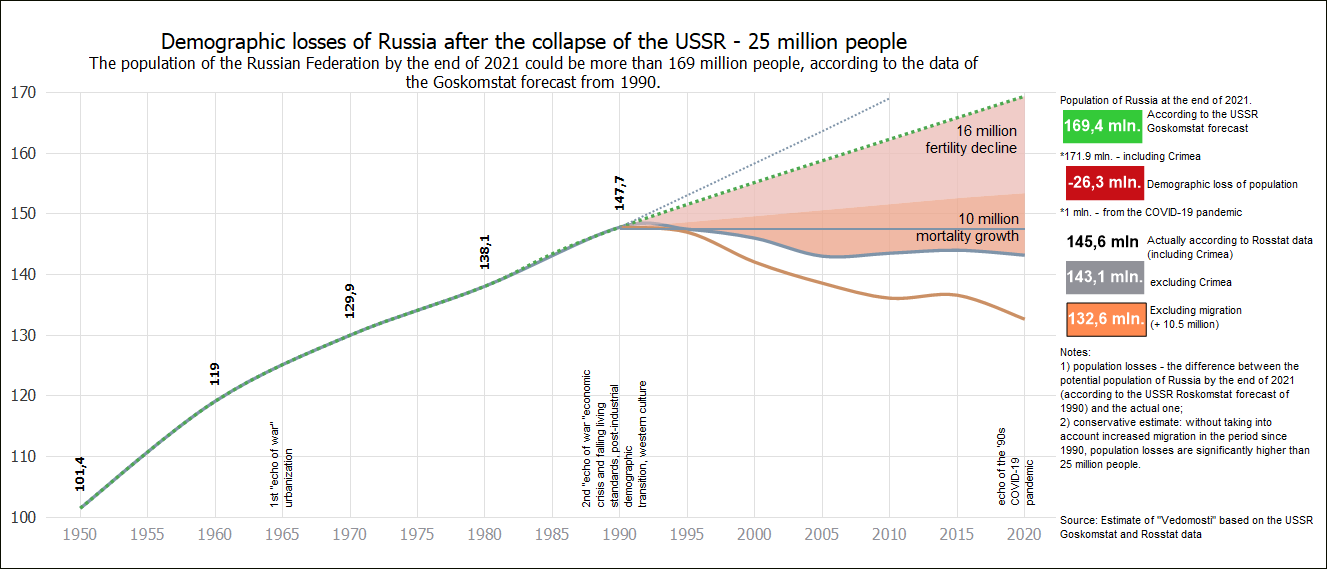
The Demographic Losses chart:
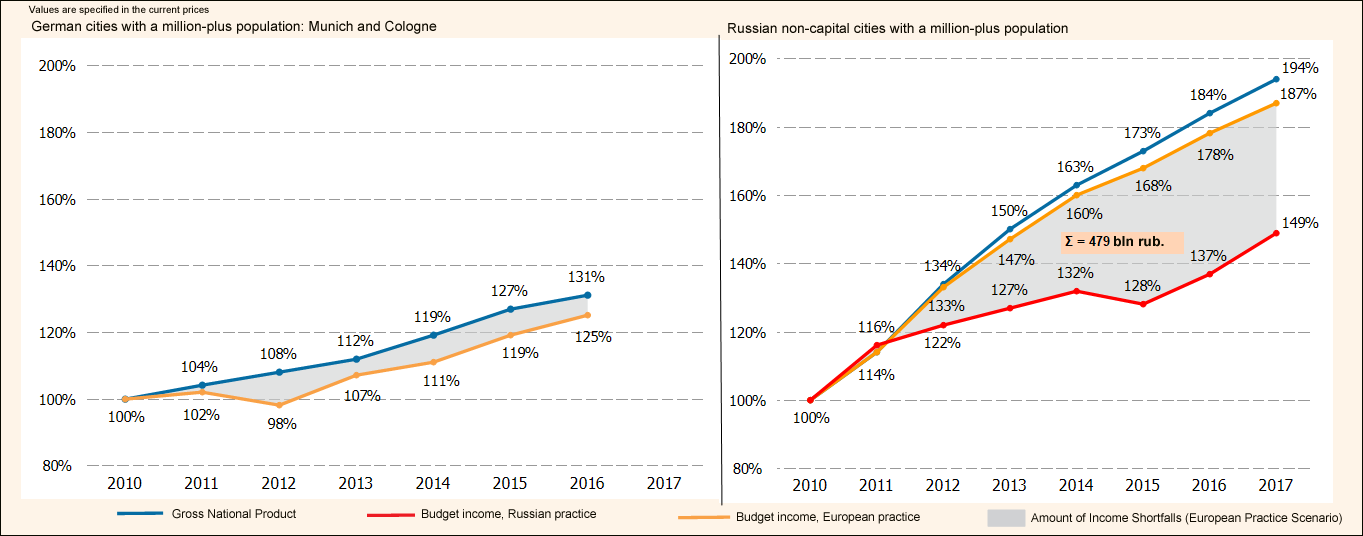
The Budget Income chart:
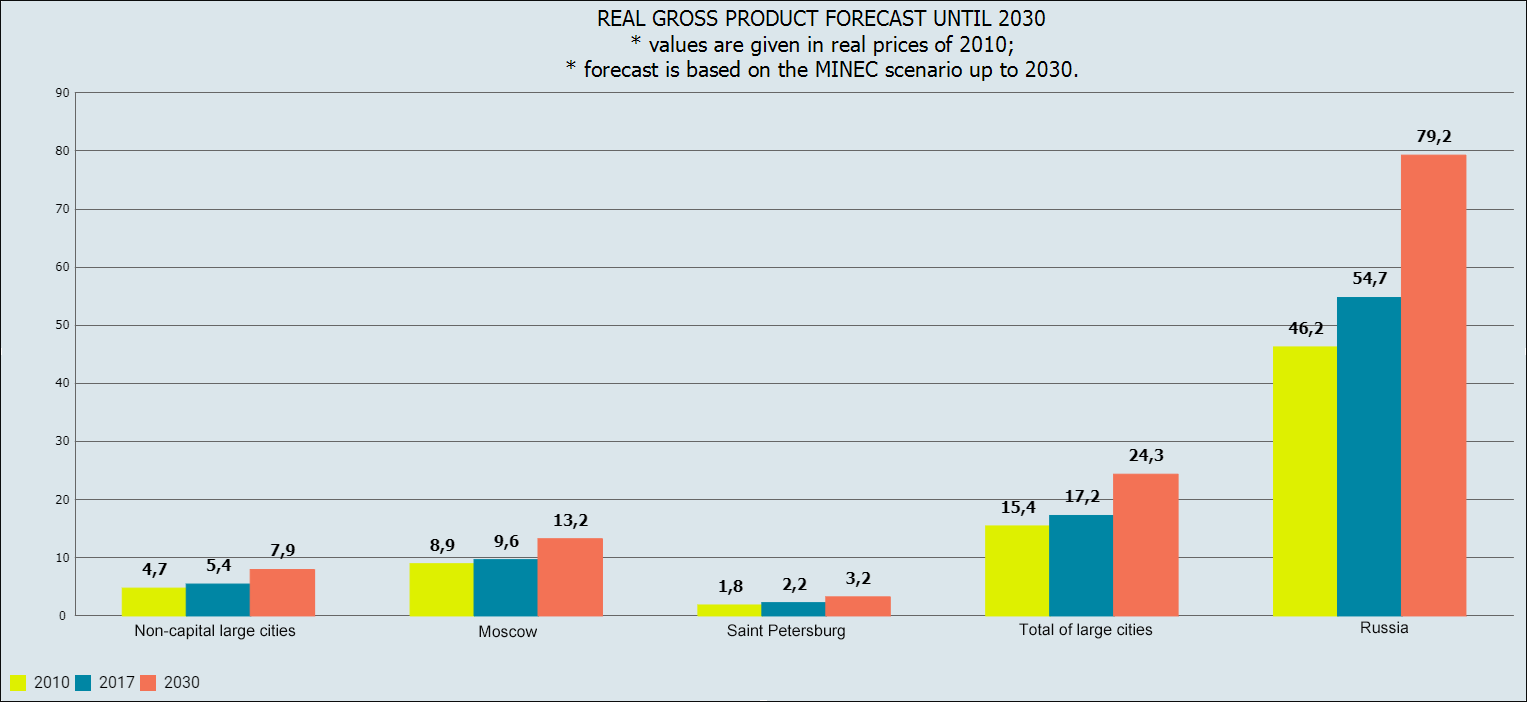
The Real Gross Product Forecast chart:
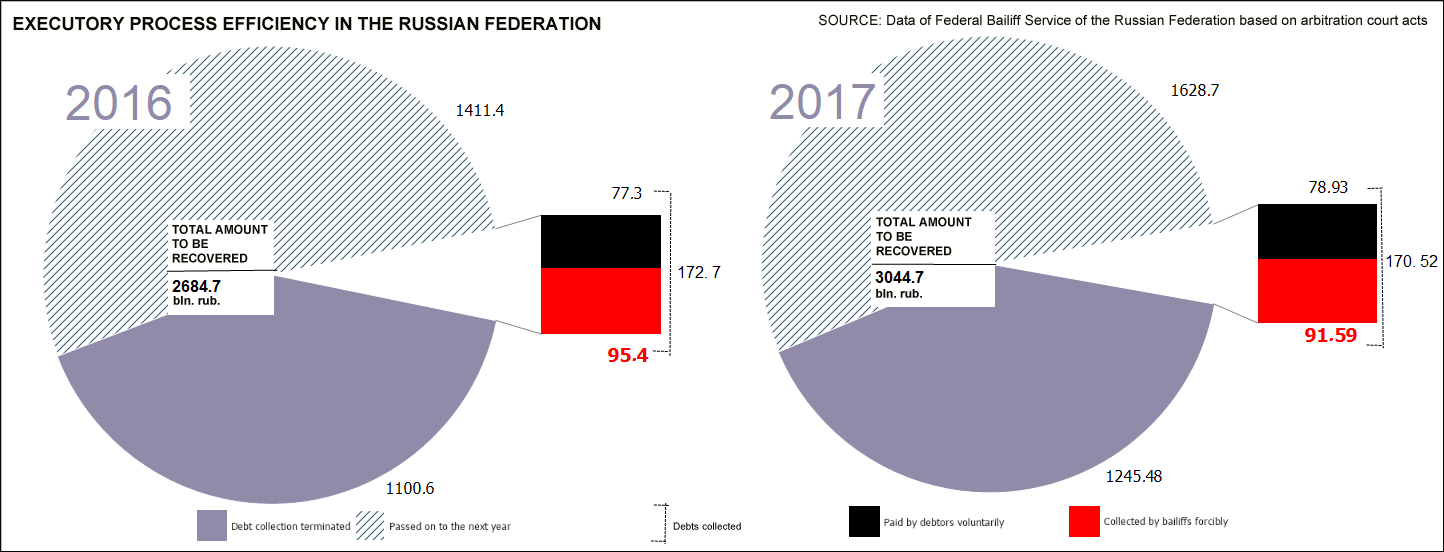
The Executory Process Efficiency chart:
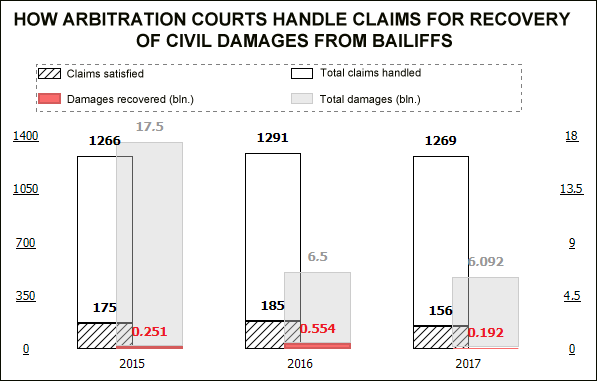
The How Arbitration Courts Handle Claims for Recovery of Damages from Bailiffs chart:
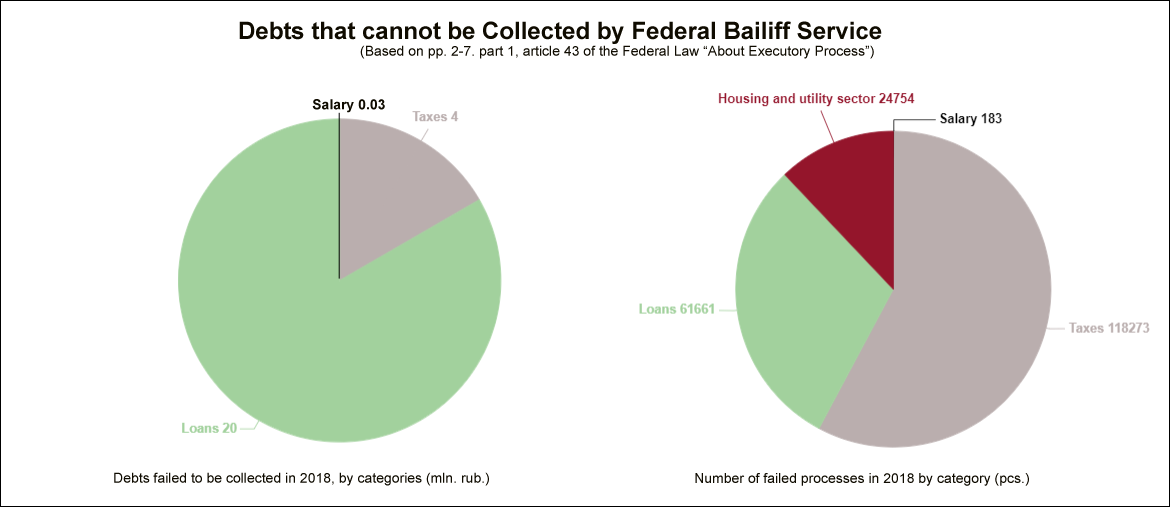
The Debt Collection chart:
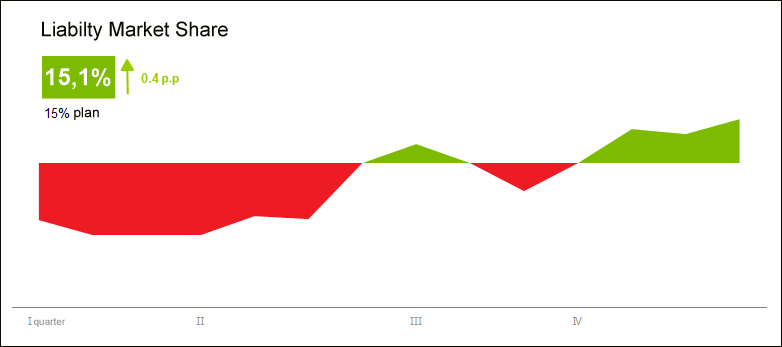
The Liability Market Share chart:
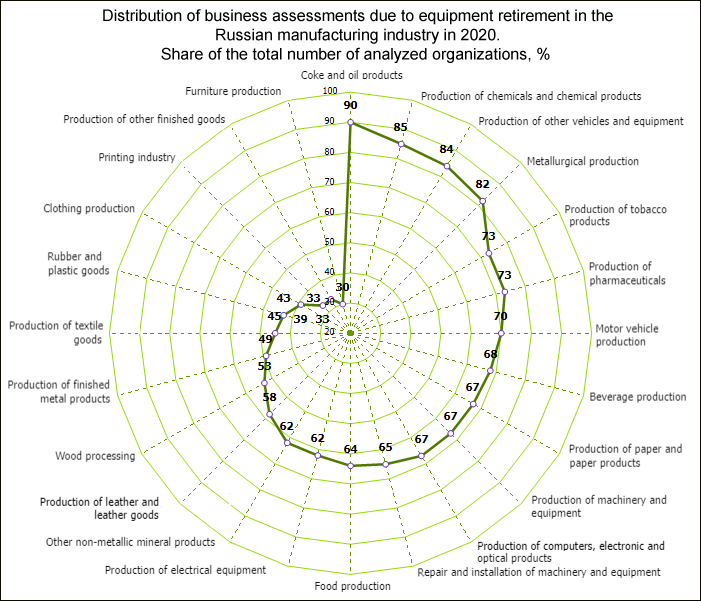
The Assessment Distribution chart:
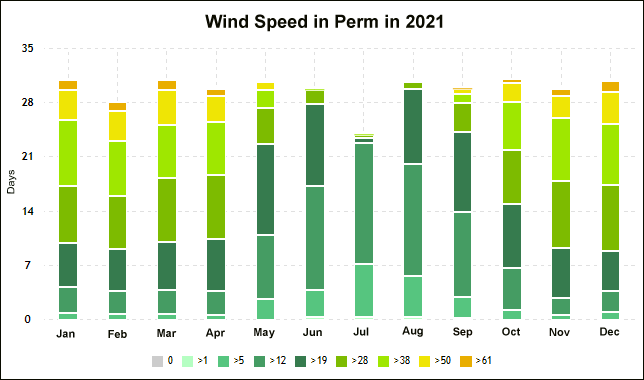
The Wind Speed chart:
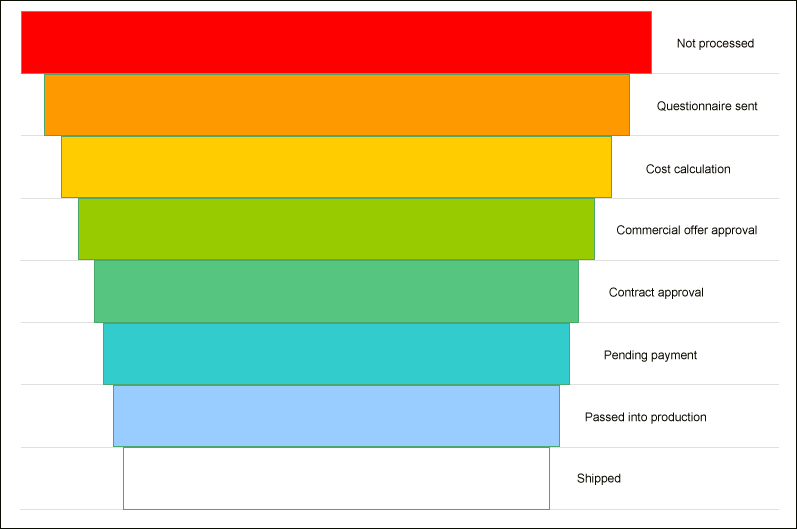
The Marketing Funnel chart:
See also:
Chart | Chart Examples | Building Report for Printing