A: Double;
The A property determines limit of segment [A, B].
To execute the example, create a form, place the ChartBox component named ChartBox1 and the UiChart component named UiChart1 on the form. Specify UiChart1 as a data source for the ChartBox component. The MyFormOnCreate procedure is a handler of the OnCreate event for the form. The UiChart1OnGetDataValue procedure is a handler of the OnGetDataValue event for the UiChart component. Add links to the Stat and UI system assemblies.
Class MyForm: Form
UiChart1: UiChart;
ChartBox1: ChartBox;
Uniform: SmUniformDistribution;
Values: Array Of Double;
Const Cnt = 10;
Sub MyFormOnCreate(Sender: Object; Args: IEventArgs);
Begin
Uniform := New SmUniformDistribution.Create;
Text := Uniform.DisplayName; // Distribution name will be displayed in form title bar
Uniform.A := 0.1;
Uniform.B := 0.8;
Values := Uniform.RandomVector(Cnt);
If Uniform.Status <> 0 Then
WinApplication.InformationBox(Uniform.Errors);
End If;
UiChart1.PointCount := Cnt;
UiChart1.SerieCount := 1
End Sub MyFormOnCreate;
Sub UiChart1OnGetDataValue(Sender: Object; Args: IUiChartGetDataValueEventArgs);
Begin
Args.Result := True;
If Args.PointIndex < Cnt Then
Args.Value := Values[Args.PointIndex];
Args.Result := True;
End If;
End Sub UiChart1OnGetDataValue;
End Class MyForm;
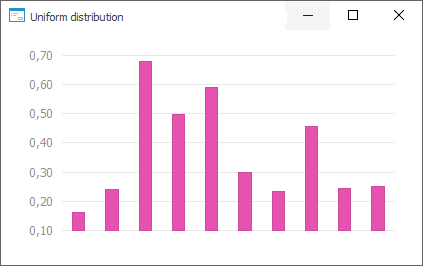
After executing the example a uniform distribution graph is created for the value:
See also: