Mean: Double;
The Mean property determines expected value.
Executing the example requires a form with the ChartBox and UiChart components, the UiChart component is a data source for ChartBox.
Class MyDistributionForm: Form
ChartBox1: ChartBox;
UiChart1: UiChart;
LogNorm: SmLogNormalDistribution;
Values: Array Of Double;
Const Cnt = 100;
Sub UiChart1OnGetDataValue(Sender: Object; Args: IUiChartGetDataValueEventArgs);
Begin
If Args.PointIndex < Cnt Then
Args.Value := Values[Args.PointIndex];
Args.Result := True;
End If;
End Sub UiChart1OnGetDataValue;
Sub MYDISTRIBUTIONFormOnCreate(Sender: Object; Args: IEventArgs);
Begin
LogNorm := New SmLogNormalDistribution.Create;
Text := LogNorm.DisplayName;
LogNorm.Mean := 3.6;
LogNorm.Variance := 0.5;
Values := LogNorm.RandomVector(Cnt);
UiChart1.PointCount := cnt;
UiChart1.SerieCount := 1;
UiChart1.Type := ChartType.Lines;
End Sub MYDISTRIBUTIONFormOnCreate;
End Class MyDistributionForm;
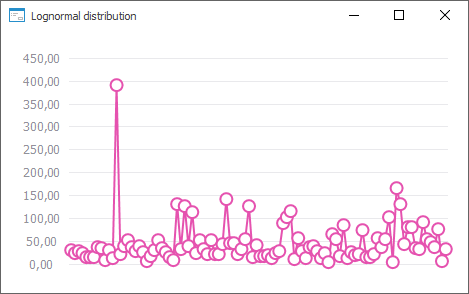
After executing the example a graph of logarithmically normal distribution is created:
See also: