DataMappingToLegendAssignment(legend: IVZLegendBase): IVZDataVisual;
legend. Legend object.
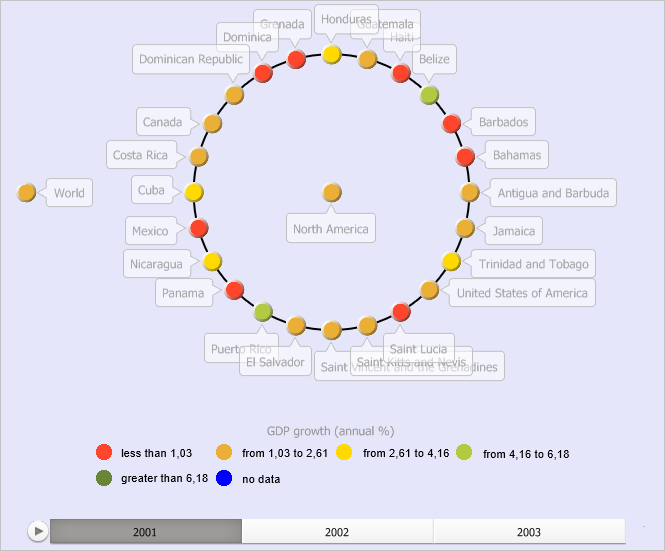
The DataMappingToLegendAssignment property determines binding of bubble tree data to the legend.
Executing the example requires that the repository contains an express report with the EXP identifier. The unit containing the example should have links to the Express, Metabase, Drawing and Visualizators system assemblies. The specified procedure should be called from the Main entry point.
Before executing this example, the bubble tree looks as shown on the IVZBubbleTree interface description page. Set a new background for the bubble tree, get a collection of legends and set a new font color for text elements of the legend. Get color visualizer, set color fill for the no data bubble, and set color visualizer for the legend. Get the timeline and set a new font color for timeline text elements. Get bubble tree parameters as XML file and change orbits color. Display options of animation and active printing mode:
Sub UserProc;
Var
Metabase: IMetabase;
EaxAnalyzer: IEaxAnalyzer;
BubbleTree: IVZBubbleTree;
Legends: IVZLegends;
Legend: IVZLegendBase;
TimeLine: IVZTimeLine;
BubbleTreeXML: String;
DataVisual: IVZColorVisual;
Brush: IGxSolidBrush;
Begin
// Get the current repository
Metabase := MetabaseClass.Active;
// Get express report
EaxAnalyzer := Metabase.ItemById("EXP").Edit As IEaxAnalyzer;
// Get bubble tree
BubbleTree := EaxAnalyzer.BubbleTree.BubbleTree;
// Get legends collection
Legends := BubbleTree.Legends;
// Get legend from collection
Legend := Legends.Item(0);
// Set new font color for legend text elements
Legend.Style.FontColor := New GxColor.CreateRGB(0, 0, 0);
// Get color visualizer
DataVisual := BubbleTree.ColorVisual;
// Set fill for the no data bubble
Brush := DataVisual.ColorMapping.Data("") As IGxSolidBrush;
If Brush <> Null Then
Brush.Color := New GxColor.CreateRGB(0, 0, 255);
End If;
// Set color visualizer for legend
BubbleTree.DataMappingToLegendAssignment(Legend) := DataVisual.ColorMapping;
// Get time line
Timeline := BubbleTree.TimeLine;
// Set new font color for time line text elements
Timeline.Style.FontColor := New GxColor.CreateRGB(0, 0, 0);
// Change orbit color
BubbleTree.OrbitsPen.Color := New GxColor.CreateARGB(255,0,0,0);
// Get express report
(EaxAnalyzer As IMetabaseObject).Save;
End Sub UserProc;
After executing the example a new font color for text elements of legend and timeline is set, color of the no data bubble is set, orbit color is changed:
Also, the development environment console window shows options of animation and active printing mode:
Animation enabled: True
Active printing mode enabled: False
See also: