DisplayLegend: Boolean;
The DisplayLegend property determines whether the chart legend is displayed in the express report table.
Available values:
True. The chart legend is displayed in a single column of the express report table.
False. Default value. The chart legend is not displayed in the express report table.
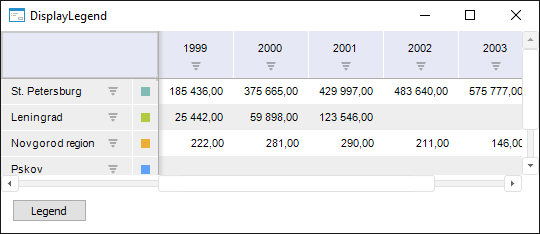
The example of displaying the chart legend in the express report table:

One can set any name for the chart legend column regardless of the selected name type from the heading/sidehead in the table corner.
Executing the example requires a form with a set of components:
Button. The component implementing the button named Button1.
UiErAnalyzer. The component that is a data source for the TabSheetBox component named UiErAnalyzer1. Select the express report with a chart in the Object property.
TabSheetBox. The component displaying a table named TabSheetBox1. Select the UiErAnalyzer1 data source in the Source property for the component.
Add links to the Express, Forms, and Tab system assemblies.
The example is a handler of the OnClick event for the Button1 component.
Sub Button1OnClick(Sender: Object; Args: IMouseEventArgs);
Var
Analyzer: IEaxAnalyzer;
EaxGrid: IEaxGrid;
Begin
UiErAnalyzer1.Active := True;
Analyzer:= UiErAnalyzer1.ErAnalyzer;
EaxGrid:= Analyzer.Grid;
EaxGrid.DisplayLegend:= Not EaxGrid.DisplayLegend;
End Sub Button1OnClick;
After executing the example the chart legend is shown or hidden for the specified express report on button click.
See also: