 To apply the method
Aggregation is the calculation of data of the upper level based on the data of the lower level. For example, calculated monthly data is summed to get quarterly data.
Available aggregation methods:
Aggregation (Sum). It aggregates data by summing up values of frequency elements.
Aggregation (Average). It aggregates data by finding the average value of frequency elements.
Aggregation (Minimum). It aggregates data by finding the minimum value of frequency elements.
Aggregation (Maximum). It aggregates data by finding the maximum value of frequency elements.
Aggregation (First Element). It aggregates data by finding the first available value of the frequency elements.
Aggregation (Last Element). It aggregates data by finding the last available value of the frequency elements.
Aggregation (Standard Deviation). It aggregates data by finding the standard deviation of the frequency. The standard deviation is a measure of how spread out element values are relative to the average value.
The methods are included into to the Aggregation group.
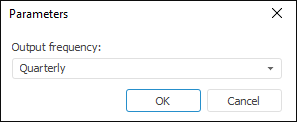
After applying the method the Parameters dialog opens:

Specify the output frequency of the calculated series in the Output Frequency drop-down list. The only available frequencies are those, which are greater than frequencies of the series, for which the method is applied. For example, if aggregation is calculated only for a series with quarterly frequency, the Output Frequency drop-down list will contain the Annual and Semi-Annual options.
A corresponding message is displayed if there are no available frequencies that can be used as the output frequency.
A series with the name of the Collapse(<Series_Name>) type that contains calculation results is added to the data table for each of the selected series. For example:

To change aggregation calculation method, use the Parameters tab on the side panel.

In the Method drop-down list select the required aggregation by time calculation method.
See also: