Click the ![]() Chart button in the Insert group of the FORESIGHT ribbon tab.
Chart button in the Insert group of the FORESIGHT ribbon tab.
A chart is a means of visual displaying of report table data and is used to graphically present the data.
To get started with a chart:
Click the ![]() Chart button in the Insert group of the FORESIGHT ribbon tab.
Chart button in the Insert group of the FORESIGHT ribbon tab.
The drop-down menu opens where the user can select a chart type:
Histogram.
Line chart.
Pie chart.
Area chart.
Scatter chart.
Radar chart.
A chart is created on a new sheet in a Microsoft Excel book. A chart sheet is inserted after the active sheet in a Microsoft Excel workbook.
NOTE. One table can be used as a data source only for one chart.
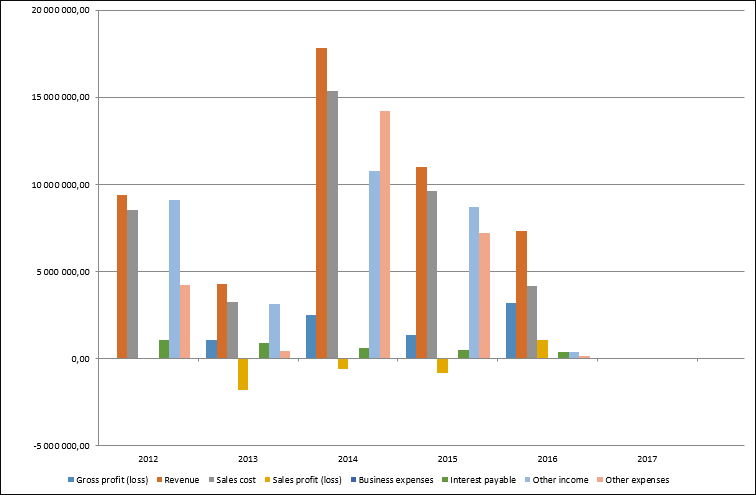
Example of chart:
Use the Format group of tabs on the side panel to determine chart settings:
Standard operations are also available on working with a chart in Microsoft Excel:
Change chart type.
Rotate data source.
Select data to plot a chart.
Set up chart layout and style.
Change chart position.
Resize chart, and so on.
See also: