addElement(elem: PP.Ui.PlacedControlBase);
elem. Add a visualizer.
The addElement method adds a visualizer to container.
To execute the example, the HTML page must contain the BubbleChart component named bubbleChart (see Example of Creating the BubbleChart Component).
Add a container of visualizers where add a legend of the bubble chart and set container offsets. Change transparency of the container item. In the development environment console display also following parameters of the container:
Sizes of items container.
Container alignments.
Container general sizes.
Attribute which determines whether container will automatically decrease workspace.
Number of items in the container.
// Create a container of visualizers
var settings = {
    HorizontalAlignment: PP.HorizontalAlignment.Center,
    VerticalAlignment: PP.VerticalAlignment.Bottom
}
var container = new PP.Ui.DataVisualizerContainer(settings);
// Get bubble chart legend
var legend = bubbleChart.getLegendById("1_BubbleChart71");
// Add the legend in the container
container.addElement(legend);
// Set container offsets
container.setLeft(100);
container.setTop(350);
// Display visualizer container sizes
console.log("Item container width: " + container.getWidth());
console.log("Item container height: " + container.getHeight());
// Display vertical and horizontal alignment types of the container
console.log("Vertical alignment of item container: " + container.getVerticalAlignment());
console.log("Horizontal alignment of item container: " + container.getHorizontalAlignment());
// Display general sizes of item container
console.log("General width of item container: " + container.getRealWidth());
console.log("General height of item container: " + container.getRealHeight());
// Display the attribute that the container does not decrease its workspace
console.log("Attribute determining whether the container will automatically decrease the workspace: " + container.getIsOverlap());
// Display number of items in the container
console.log("Number of items in the container: " + container.getLength());
// Change container item transparency
container.getElements()[0].setOpacity(0.5);
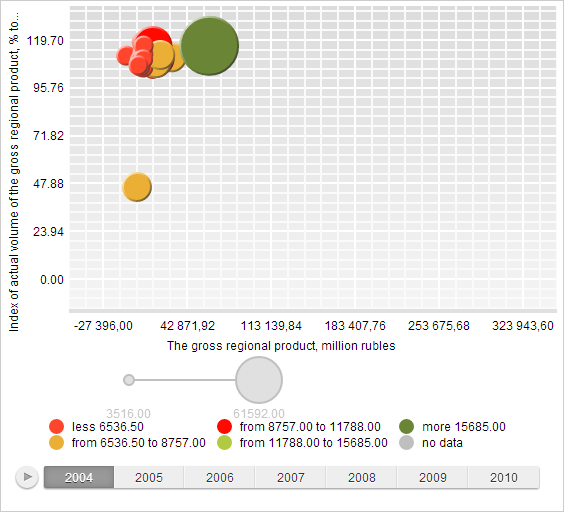
As a result of executing the example, position and transparency value of the bubble chart legend is changed:
The development environment console also displays visualizer container parameters:
Item container width: 166
Item container height: 65
Item container vertical alignment: Bottom
Item container horizontal alignment: Center
Item container general width: 166
Item container general height: 65
Attribute which determines whether container will automatically decrease workspace: false
Number of items in the container: 1