draw(year: Number, noAnimation: Boolean);
year. Index of the year for which data is to be rendered.
noAnimation. The attribute indicates whether animation is played. If the parameter is set to True, chart animation is not played, otherwise it is so (default).
The draw method completely redraws a chart.
To execute the example, the HTML page must contain the BubbleChart component named bubbleChart (see Example of Creating the BubbleChart Component). Show data of the next year in the bubble chart:
// Get time line
var timeline = bubbleChart.getTimeline();
// Render data for the next year
bubbleChart.draw(timeline.getCurrentStep() + 1);
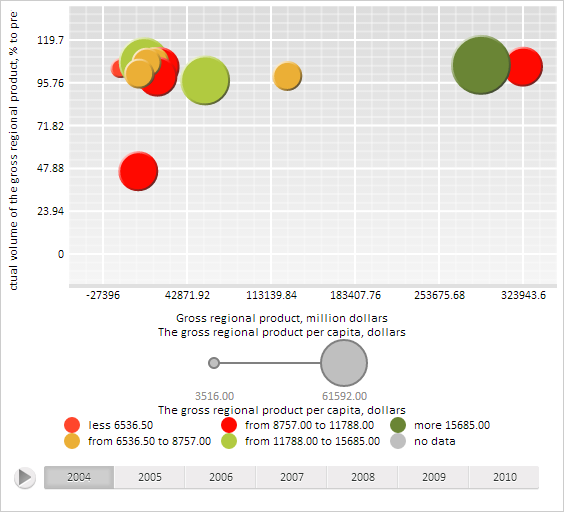
After executing the example the bubble chart shows data for the next year:
See also: