addRow();
The addRow method adds a new row to the table of spliced time series.
To execute the example, the HTML page must contain the WorkbookBox component named workbookBox (see Example of Creating the WorkbookBox Component). Add three rows to the table of spliced time series, next remove the two last rows from the table:
// Get workbook properties panel
var propertyBar = workbookBox.getPropertyBarView();
// get parameters panel
var parametersPanel = propertyBar.getParametersPanel();
// Display panel
parametersPanel.show();
// Expand panel
parametersPanel.expand();
// Get and display time series splice wizard
var spliceMethodWizard = parametersPanel._SpliceMethodWizard;
// Display wizard
spliceMethodWizard.show();
// Get table data source for specified wizard
var tabSheetDS = spliceMethodWizard._DataSource;
// Add three rows to table
tabSheetDS.addRow();
tabSheetDS.addRow();
tabSheetDS.addRow();
console.log("Number of table rows before adding: " + (tabSheetDS.getRowsCount() - 1));
// Delete the second and the third rows
tabSheetDS.deleteRow(1, 2);
console.log("Number of table rows after delete:" + (tabSheetDS.getRowsCount() - 1));
// Load data to table
tabSheetDS.loadMeasures();
// Refresh table
spliceMethodWizard._TabSheet.update();
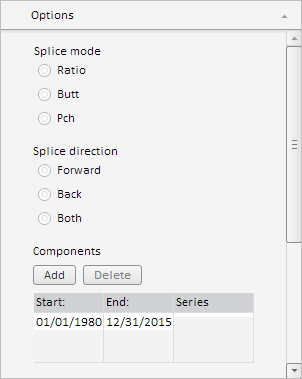
After executing the example only one of the three added rows remains in the table of spliced time series:

The browser console displays the number of rows in this table after the rows are added and removed:
Number of table rows after adding: 3
Number of table rows after removing: 1
See also: