Create the HTML page and perform the following steps to execute an example:
1. In the HEAD tag add links to the following JS and CSS files:
PP.js.
PP.Metabase.js.
PP.Report.js.
resources.ru.
PP.css.
PP.Report.css.
2. Add the following script in the SCRIPT tag:
    var metabase, prxReport, prxMbService, dataArea;
    function renderReport() {
        metabase = new PP.Mb.Metabase(//create a repository connection
		{
		    PPServiceUrl: "PPService.axd?action=proxy",
		    Id: "WAREHOUSE",
		    UserCreds: { UserName: "user", Password: "password" }
		});
        metabase.open();//open repository
        prxMbService = new PP.Prx.PrxMdService({ Metabase: metabase });//create a service for working with regular reports
        prxReport = prxMbService.open(699099);//open report from repository by key
        dataArea = new PP.Prx.Ui.DataArea(
		{
		    ParentNode: "dataArea",
		    Source: prxReport,//specify source report
		    Service: prxMbService
		});
        window.onresize();
    }
    var idTime;
    //function for resizing component on container resize
    window.onresize = function updateSize() {
        if (idTime)
            clearTimeout(idTime);
        idTime = setTimeout(function () {
            if (dataArea)
                dataArea.setSize(document.getElementById("dataArea").offsetWidth - 2, 800);
            idTime = null;
        }, 50);
    };
3. In the BODY tag add the following code:
<body onselectstart="return false" onload="renderReport()" style="height: 100%;">
<div id="dataArea" style="height: 800px;">
</div>
</body>
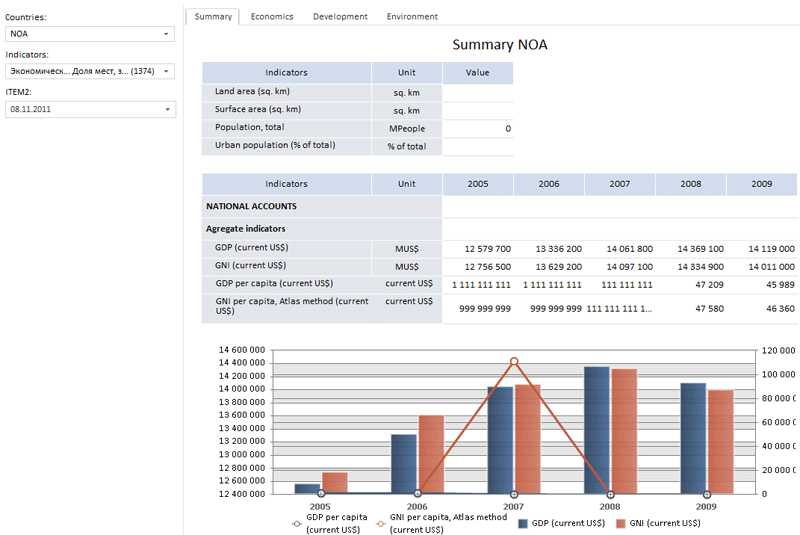
After executing the example the HTML page contains DataArea component that looks as follows:

Data area appearance depends on the source report. If the report does not contain any controls, the control bar is not displayed in the data area. Graphs are shown as images.
See also: