PP.MapVisualItem(settings);
settings. JSON object that contains values of class properties.
The MapVisualItem constructor creates an instance of the MapVisualItem class.
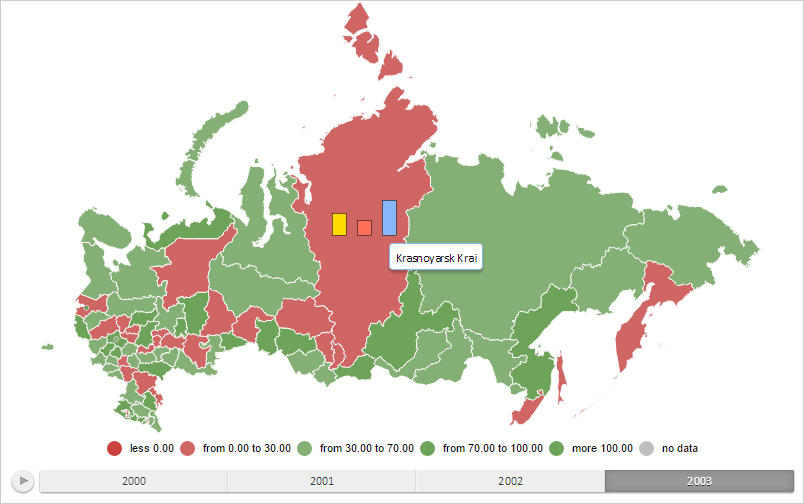
To execute the example the HTML page must contain the MapChart component named map (see Example of Creating the MapChart Component). Add a new visual item to the map - the bar factor for the map layer area with the RU-KYA identifier and a tooltip:
// Return a layer with map areas
function getWorkLayer() {
    return map.getLayer("Regions");
}
// Return current index of the calendar dimension
function getSelectedIndex() {
    return 2;
}
// Return base class of the map bar factor
function getBarVisual() {
    return map.getVisuals().barVisual0;
}
// Return map layer area with selected identifier
function getShape(shapeId) {
    var shape = getWorkLayer().getParentLayer().getShape(shapeId);
    map.setBarHoverness(shape);
    return shape;
}
// Create a tooltip
function createToolTip() {
    var toolTip = new PP.Ui.ChartTooltipBase({
        HoverMode: PP.HoverMode.Click,
        MaskText: {
            IsAuto: true,
            Value: "{%Name}"
        }
    });
    toolTip.setFont(new PP.Font());
    return toolTip;
}
// Render the tooltip
function drawToolTip(mapBar) {
    // Show the tooltip
    mapBar.getToolTip().setIsVisible(mapBar.getIsVisible());
    mapBar.toggleToolTip();
}
// Create the bar factor
function createMapBar() {
    // Create the bar factor
    var mapBar = new PP.MapBar({
        BarDistance: 10, // Distance between columns
        Chart: map,
        Shape: getShape("RU-KYA"), // Map layer area for which the factor is created
        MaxBarsCount: 3, // Maximum number of columns
        BorderThickness: 0.5, // Border thickness of clumns
        IsVisible: false, // Hide the bar factor
        Visual: getBarVisual(),
        Layer: getWorkLayer(), // Map layer
        LeastWidthPart: 10, // Column width with a minimum value
        LeastHeightPart: 15, // Column height with a minimum value
        IsPercentage: false, // Column value is a percentage
        ToolTip: createToolTip() // Tooltip
    });
    mapBar.showBar = function () {
        // Show the tooltip
        this.show();
        // Show the bar factor
        this.setIsVisible(true);
        this.drawBar();
    };
    mapBar.hideBar = function () {
        // Hide the bar factor
        this.setIsVisible(false);
        this.drawBar();
        // Hide the tooltip
        this.hide();
    };
    mapBar.drawBar = function () {
        // Render the bar factor
        this.draw();
        this.getChart().draw();
    };
    return mapBar;
}
// Render the bar factor
function drawMapBar(mapBar) {
    mapBar.setSelectedIndex(getSelectedIndex());
    mapBar.getLayer().getMapBarCollection().push(mapBar);
    mapBar.drawBar();
}
// Show coordinates of the current position of the bar factor
function printBarPosition(mapBar) {
    console.log("Position of bar factor: (%s, %s)",
        mapBar.getLeft(), mapBar.getTop());
}
// Show sizes of bar factor
function printBarSize(mapBar) {
    console.log("Sizes of bar factor: %s x %s",
        mapBar.getWidth(), mapBar.getHeight());
}
// Move the bar factor
function moveBar(mapBar, x, y) {
    var rect = mapBar.getBoundsRect();
    mapBar.updatePosition(rect.getLeft() + rect.getWidth() / 2 + x,
        rect.getTop() + rect.getHeight() / 2 + y);
    mapBar.renderFrame(mapBar.getChart().getBarLayer());
}
// Create the bar factor
var mapBar = createMapBar();
// Render the bar factor
drawMapBar(mapBar);
// Show the tooltip
drawToolTip(mapBar);
After executing the example, a new visual item - the bar factor for the map layer area with the RU-KYA identifier with a tooltip is added. They are hidden.
Now show this factor, replace it 50 pixels down and determine a new layout and sizes:
// Show a bar factor
mapBar.showBar();
// Replace it 50 pixels down
moveBar(mapBar, 0, 50);
// Determine factor layout
printBarPosition(mapBar);
// Determine factor layout
printBarSize(mapBar);
After executing the example, the bar factor is shown. It is moved 50 pixels down. Factor columns have absolute values and are located in 10 pixels:

The browser console displays coordinates of the new position and sizes:
Position of the bar factor: (328.513951, 250.248882)
Sizes of the bar factor: 65 x 35
To hide bar factor and tooltip, it is necessary to execute the following line of code:
mapBar.hideBar();
After execution, the bar factor and the tooltip were hidden.
See also: