Visual: PP.AreaVisual;
The Visual property determines data mapping settings of the map layer area.
Use JSON or the setVisual method to set the property value and the getVisual method to get the property value.
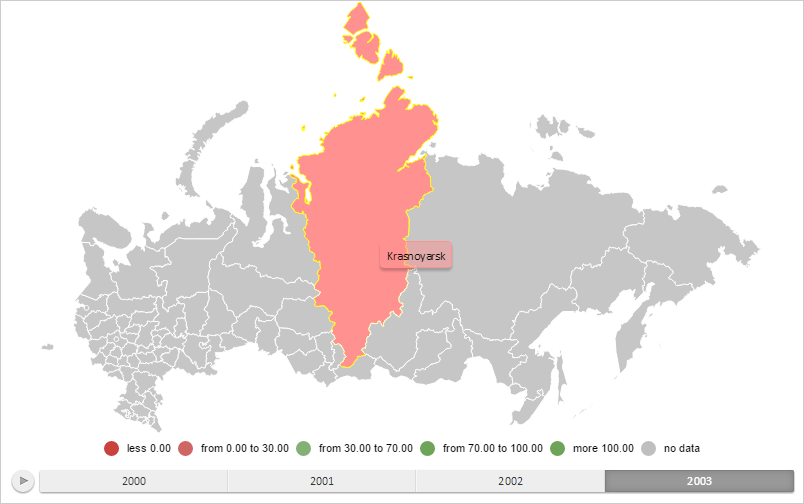
To execute the example the HTML page must contain the MapChart component named map (see Example of Creating the MapChart Component). Apply new settings for a map layer area with the RU-KYA ID and show a tooltip for it:
// Returns a layer with map areas
function getWorkLayer() {
    return map.getLayer("Regions");
}
// Returns a base class of the map territory factor
function getAreaVisual() {
    return getWorkLayer().getVisual();
}
// Returns data source
function getDataSource() {
    return map.getDataSources().DataSource0;
}
/* Creates an object to work with settings
of data mapping for the territory factor */
function createAreaVisual() {
    var areaVisual = {
        ColorMapping: getColorMapping(),
        HeightMapping: getAreaVisual().getHeightMapping(),
        Id: "MapAreaVisual"
    };
    return areaVisual;
}
/* Creates settings of data mapping
with the fill color of the map layer area */
function getColorMapping() {
    var colorMappings = new PP.DataMapping({
        DataSource: getDataSource(),
        Type: PP.DataMappingType.Scale,
        DimAttributeId: "areaColor0",
        Id: "areaColor0",
        // Determine a scale
        Scale: new PP.ScaleBase({
            Items: "#FF705B #FF9191 #C3D66C #6BBC80 #82BAB6 Transparent",
            NoData: "Gray",
            TypeArguments: "Brush",
            Id: "MapScale0",
            Values: "0 30 70 100"
        })
    })
    return colorMappings;
}
// Creates tooltip
function createToolTip() {
    var toolTip = new PP.Ui.ChartTooltipBase({
        HoverMode: PP.HoverMode.Click,
        MaskText: {
            IsAuto: true,
            Value: "{%Name}"
        }
    });
    return toolTip;
}
// Creates a bubble factor
function createMapShape() {
    var mapShape = getWorkLayer().getShape("RU-KYA");
    mapShape.setVisual(createAreaVisual());
    mapShape.setValue("Krasnoyarsk");
    mapShape.setToolTip(createToolTip());
    var domNode = mapShape.getDomNode();
    domNode.setAttribute("stroke", PP.Color.Colors.yellow);
    mapShape.setDomNode(domNode);
    return mapShape;
}
// Render a map territory info
function drawMapShape(mapShape) {
    if (mapShape.getDomNode() == null) {
        mapShape.draw();
    }
    var shapes = getWorkLayer().getShapes();
    shapes[mapShape.getId()] = mapShape;
    // Refresh a map
    map.refresh();
}
// Render a tooltip
function drawToolTip(mapShape) {
    // Determine fill color of the tooltip
    var toolTipColor = mapShape.getToolTipColor();
    mapShape.getToolTip().setBackground(new PP.SolidColorBrush({
        Color: toolTipColor,
        Opacity: 0.5
    }));
    mapShape.getToolTip().setFont(new PP.Font());
    // Show the tooltip
    mapShape.toggleTooltip(mapShape.getCenter().getX(), mapShape.getCenter().getY());
}
// Shows information about map layer area
function printShapeInfo(mapShape) {
    if (mapShape.getIsRendered()) {
        console.log("The %s map layer area is successfully rendered", mapShape.getId());
    }
    console.log("Current fill color of the %s map layer area: %s", mapShape.getId(), mapShape.getCurrentBrush().getColor());
    if (mapShape.getIsSettingsCreated()) {
        console.log("Map layer area was created basing on the user's settings");
    } else {
        console.log("Map layer area was created basing on the settings received on topobase parsing");
    }
    console.log("The 1%s map layer area is 2%s transparent", mapShape.getId(), (mapShape.isOpaque() ? "not " : ""));
}
// Displays information showed in the tooltip
function printToolTipInfo(mapShape) {
    console.log("The tooltip is shown for the %s map layer area", mapShape.getToolTipValues().Name);
}
// Get map layer area
var mapShape = createMapShape();
// Render the area
drawMapShape(mapShape);
// Show the tooltip
drawToolTip(mapShape);
// Display information about map layer area
printShapeInfo(mapShape);
// Display information showed in the tooltip
printToolTipInfo(mapShape);
After executing the example, new data mapping settings were defined, a new value "Krasnoyarsk" was set, an area border was colored into yellow, a tooltip is shown for the map layer area with the RU-KYA identifier:

The browser console displays an information about the map layer area with the RU-KYA identifier and the tooltip:
The RU-KYA map layer area is successfully rendered
Current fill color of the RU-KYA map layer area: #FF9191
The map layer area was created basing on the settings received on topobase parsing
The RU-KYA map layer area is not transparent
The tooltip is shown for the Krasnoyarsk map layer area
See also: