PP.MapPie(settings);
settings. JSON object that contains values of class properties.
The MapPie constructor creates an instance of the MapPie class.
To execute the example the HTML page must contain the MapChart component named map (see Example of Creating the MapChart Component). Create a pie factor for a map layer area with the RU-KYA identifier and show a tooltip for it:
// Returns layer with map areas
function getWorkLayer() {
    return map.getLayer("Regions");
}
// returns current dimension marker for map axis
function getTimelineIndex() {
    return 1;
}
// Returns basic class of pie map factor
function getPieVisual() {
    return map.getVisuals().pieVisual0;
}
// Creates an object for working with data mapping settings for pie factor
function createPieVisual() {
    var pieVisual = new PP.PieVisual({
        AngleMappings: getPieVisual().getAngleMappings(),
        BorderMappings: getPieVisual().getBorderMappings(),
        ColorMappings: getPieVisual().getColorMappings(),
        RadiusMappings: getPieVisual().getRadiusMappings()
    });
    // Set up object of pie factor basic class
    pieVisual.setup(getTimelineIndex());
    return pieVisual;
}
// Output information about bar factor
function printPieVisualInfo(mapPie) {
    console.log("Main data mapping: %s", mapPie.getMainMappingId(getTimelineIndex()));
    console.log("Maximum number of data mappings: %s", mapPie.getVisual().getMappingsCount());
    console.log("Data source identifier for first mapping: %s", mapPie.getVisual().getFirstDataSource().getId());
}
// Returns map layer area with specified identifier
function getShape(shapeId) {
    var shape = getWorkLayer().getParentLayer().getShape(shapeId);
    map.setPieHoverness(shape);
    return shape;
}
// Creates a tooltip
function createToolTip() {
    var toolTip = new PP.Ui.ChartTooltipBase({
        HoverMode: PP.HoverMode.Click,
        MaskText: {
            IsAuto: true,
            Value: "{%Name}"
        }
    });
    toolTip.setFont(new PP.Font());
    return toolTip;
}
// Renders tooltip
function drawToolTip(mapPie) {
    // Determine tooltip fill color
    var toolTipColor = mapPie.getToolTipColor();
    mapPie.getToolTip().setBackground(new PP.SolidColorBrush({
        Color: toolTipColor,
        Opacity: 0.5
    }));
    // Display tooltip
    mapPie.toggleToolTip();
}
// Creates a pie factor
function createMapPie() {
    // Create a pie factor
    var mapPie = new PP.MapPie({
        Chart: map,
        Shape: getShape("RU-KYA"),
        MaxPiesCount: 3, // Maximum number of pie factor sectors
        BorderThickness: 0.5, // Sector border width
        HideNoData: false, // Hide sectors corresponding to zero values
        Visual: createPieVisual(),
        Layer: getWorkLayer(), // Map layer
        LeastAnglePart: 15, // Minimum sector size
        LeastRadiusPart: 30, // Minimum sector radius
        StartAngle: 90, // First sector rotation angle
        ToolTip: createToolTip(), // Tooltip
    });
    // Refreshes pie factor
    mapPie.refresh = function() {
        // Delete pie factor from map layer
        clearMapPie(this);
        // Check if there are several data mappings
        if (!mapPie.isMeta()) {
            this._isDrawed = false;
        }
        // Rerender pie factor
        this.draw();
        // Display pie factor
        this.renderFrame(this.getChart().getPieLayer())
    };
    return mapPie;
}
// Deletes pie factor from map layer
function clearMapPie(mapPie) {
    mapPie.clear();
    mapPie.getChart().getPieLayer().clear();
}
// Renders pie factor
function drawMapPie(mapPie) {
    mapPie.setSelectedIndex(getTimelineIndex());
    mapPie.getLayer().getMapPieCollection().push(mapPie);
    // Rerender map
    map.draw();
}
// Outputs information displayed in tooltip
function printToolTipInfo(mapPie) {
    // Set pie factor
    var pie1 = {};
    var pieKey = "mapPie";
    pie1[pieKey] = mapPie.getSettings();
    getWorkLayer().setPies(pie1);
    var pie2 = getWorkLayer().getPies()["mapPie"];
    console.log("Tooltip displays data for the %s region for %s year",
        pie2.getShapeId(), pie2.getToolTipValues().TimelineStep);
}
// Create a pie factor
var mapPie = createMapPie();
// Render this factor
drawMapPie(mapPie);
// Display tooltip
drawToolTip(mapPie);
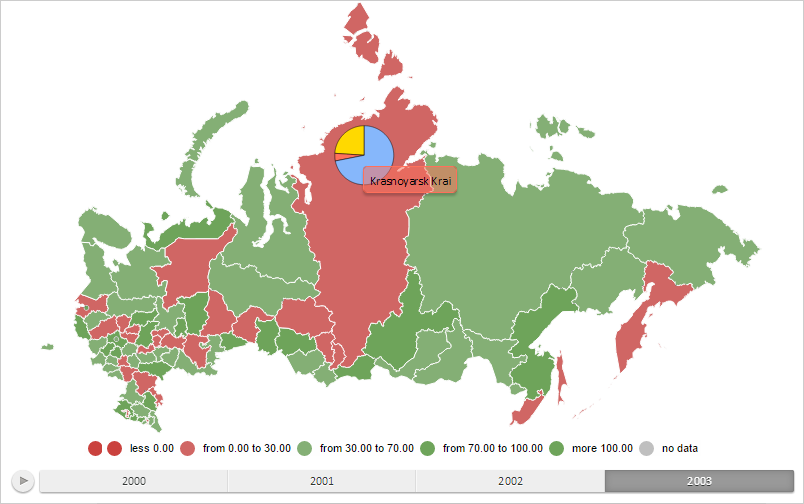
After executing the example the pie factor for map layer area with the RU-KYA identifier and the tooltip are shown for the factor:
Now, determine information about data mapping settings for a bar factor:
printPieVisualInfo(mapPie);
After executing the string line, the browser console displays name of the principle data mapping, maximum number of lines for data mapping and data source ID for the first mapping:
Principle data mapping: pieAngle0
maximum number of data mappings: 1
Data source identifier for the first mapping: BarBackSource
Determine the region and the year for which data is shown in the tooltip:
printToolTipInfo(mapPie);
After executing the example, the browser console displays the region ID and the year for which data is shown in the tooltip:
Tooltip shows data for the RU-KYA region for 2003
See also: