addSubLayer(layer: PP.MapLayer, id: String);
layer. Add a child layer.
id. Identifier of added layer.
The addSubLayer method adds a child layer.
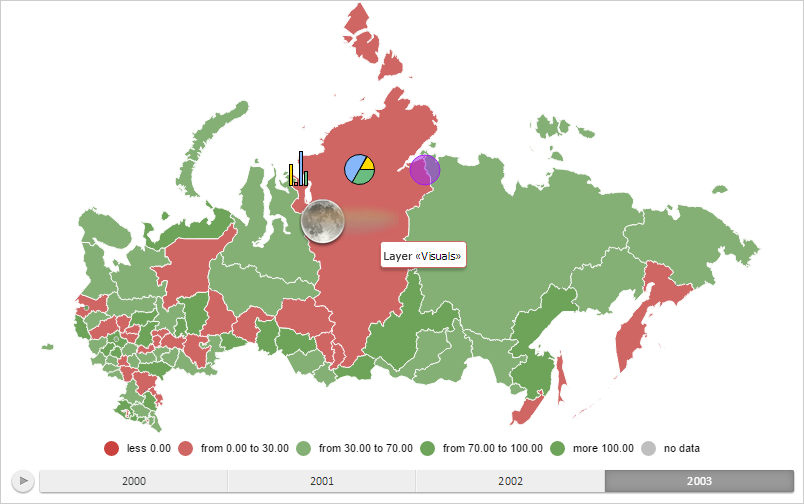
To execute the example the HTML page must contain the MapChart component named map (see Example of Creating the MapChart Component). Add the Visuals child layer with bar, pie and bubble factors to the layer with the Regions Identifier. Show also an icon and a tooltip for the RU-KYA map layer area. Hide the parent layer:
// Creates a tooltip for map layer
function createToolTip() {
    var toolTip = new PP.Ui.ChartTooltipBase({
        HoverMode: PP.HoverMode.Click,
        MaskText: {
            IsAuto: true,
            Value: "Layer «Visuals»"
        }
    });
    toolTip.setFont(new PP.Font());
    return toolTip;
}
// Renders the tooltip
function drawToolTip(shapeId) {
    var shape = getWorkLayer().getShape(shapeId);
    shape.setToolTip(getWorkLayer().getToolTip());
    var point = shape.getCenter();
    shape.toggleTooltip(point.getX(), point.getY());
}
// Creates a map layer
function createLayer(layerId) {
    var parentLayer = getParentLayer();
    // Create a layer with map factors
    var visualsLayer = new PP.MapLayer({
        Chart: map,
        DomNode: parentLayer.getDomNode(),
        VisualsOffset: 35,
        Id: layerId,
        IsVisible: false, // Hidden layer
        ParentLayer: parentLayer,
        Shapes: parentLayer.getShapes(),
        Visual: parentLayer.getVisual()
    });
    // Set tooltip
    visualsLayer.setToolTip(createToolTip());
    visualsLayer.setMilestones(getMilestones());
    visualsLayer._MapBarCollection = getMapBarCollection();
    visualsLayer._MapPieCollection = getMapPieCollection();
    visualsLayer._MapBubbleCollection = getMapBubbleCollection();
    visualsLayer.setVisual(parentLayer.getVisual());
    parentLayer.addSubLayer(visualsLayer, layerId);
    visualsLayer.draw();
    // Show child layer
    if (!visualsLayer.getIsLayersVisible()) {
        visualsLayer.show();
    }
    return visualsLayer;
}
// Returns a collection of milestones
function getMilestones() {
    var milestones = {};
    for (var i in getParentLayer().getMilestones()) {
        milestones[i] = getParentLayer().getMilestones()[i];
        delete getParentLayer().getMilestones()[i];
    }
    return milestones;
}
// Returns a collection of bar factors
function getMapBarCollection() {
    var barCollection = [];
    for (var i in getParentLayer().getMapBarCollection()) {
        var bar = getParentLayer().getMapBarCollection()[i];
        barCollection.push(bar);
    }
    getParentLayer().getMapBarCollection().length = 0;
    return barCollection;
}
// Returns a collection of pie factors
function getMapPieCollection() {
    var pieCollection = [];
    for (var i in getParentLayer().getMapPieCollection()) {
        var bar = getParentLayer().getMapPieCollection()[i];
        pieCollection.push(bar);
    }
    getParentLayer().getMapPieCollection().length = 0;
    return pieCollection;
}
// Returns a collection of bubble factors
function getMapBubbleCollection() {
    var bubbleCollection = [];
    for (var i in getParentLayer().getMapBubbleCollection()) {
        var bar = getParentLayer().getMapBubbleCollection()[i];
        bubbleCollection.push(bar);
    }
    getParentLayer().getMapBubbleCollection().length = 0;
    return bubbleCollection;
}
// Returns a layer with map factors
function getWorkLayer() {
    var layer = getParentLayer().getSubLayer("Visuals");
    return layer;
}
// Returns a layer with map areas
function getParentLayer() {
    var layer = map.getLayer("Regions");
    return layer;
}
// Shows the bar factor for selected map layer area
function showBar(shapeId) {
    var bars = getWorkLayer().getMapBarCollection();
    for (var i in bars) {
        var bar = bars[i];
        if (bar.getShape().getId() == shapeId) {
            bar.setIsVisible(true);
            bar.draw();
        }
    }
}
// Shows pie factor for selected map layer area
function showPie(shapeId) {
    var pies = getWorkLayer().getMapPieCollection();
    for (var i in pies) {
        var pie = pies[i];
        if (pie.getShape().getId() == shapeId) {
            pie.setIsVisible(true);
            pie.draw();
        }
    }
}
// Shows bubble factor for selected map layer area
function showBubble(shapeId) {
    var bubbles = getWorkLayer().getMapBubbleCollection();
    for (var i in bubbles) {
        var bubble = bubbles[i];
        if (bubble.getShape().getId() == shapeId) {
            bubble.setIsVisible(true);
            bubble.draw();
        }
    }
}
// Shows milestone for selected map layer area
function showMilestone(shapeId) {
    var parentLayer = map.getLayer("Regions");
    var milestones = getWorkLayer().getMilestones();
    for (var i in milestones) {
        var milestone = milestones[i];
        if (milestone.getShape().getId() == shapeId) {
            milestone.draw();
            map.getPaper().appendChild(milestone.getDomNode());
        }
    }
}
var shapeId = "RU-KYA";
// Create a new layer
var layer = createLayer("Visuals");
// Render factors and icon
showBar(shapeId);
showPie(shapeId);
showBubble(shapeId);
showMilestone(shapeId);
// Show a tooltip
drawToolTip(shapeId);
// Redraw a map
map.draw();
After executing the example, the Visuals child layer with bar, pie and bubble factors is added to the layer with the Regions identifier. Icon and tooltip are shown for the RU-KYA map layer area:
See also: