PP.MapBar(settings);
settings. JSON object that contains values of class properties.
The MapBar constructor creates an instance of the MapBar class.
To execute the example the HTML page must contain the MapChart component named map (see Example of Creating the MapChart Component). Create a bar factor for a map layer area with the RU-KYA identifier and show a tooltip for it:
// Returns the layer with map areas
function getWorkLayer() {
    return map.getLayer("Regions");
}
// Returns current dimension selection for the map axis
function getTimelineIndex() {
    return map.getTimeline().getCurrentStep();
}
// Returns a base class for the map bar factor
function getBarVisual() {
    return map.getVisuals().barVisual0;
}
/* Creates an object to work with data mapping settings
for the bar factor */
function createBarVisual() {
    var barVisual = new PP.BarVisual({
        BorderMappings: getBarVisual().getBorderMappings(),
        ColorMappings: getBarVisual().getColorMappings(),
        HeightMappings: getBarVisual().getHeightMappings(),
        WidthMappings: getBarVisual().getWidthMappings()
    });
    // Define settings for the base class of the bar factor
    barVisual.setup(getTimelineIndex());
    return barVisual;
}
// Shows information about bar factor
function printBarVisualInfo(mapBar) {
    console.log("Principle data mapping: %s", mapBar.getMainMappingId(getTimelineIndex()));
    console.log("Maximum number of data mappings: %s", mapBar.getVisual().getMappingsCount());
    console.log("Data source ID for the first mapping: %s", mapBar.getVisual().getFirstDataSource().getId());
}
// Returns map layer area with indicated ID
function getShape(shapeId) {
    var shape = getWorkLayer().getParentLayer().getShape(shapeId);
    map.setBarHoverness(shape);
    return shape;
}
// Creates a tooltip
function createToolTip() {
    var toolTip = new PP.Ui.ChartTooltipBase({
        HoverMode: PP.HoverMode.Click,
        MaskText: {
            IsAuto: true,
            Value: "{%Name} \n {%HeightValue} (for the {%TimelineStep} year)"
        }
    });
    toolTip.setFont(new PP.Font());
    return toolTip;
}
// Render the tooltip
function drawToolTip(mapBar) {
    // Determine fill color of the tooltip
    var toolTipColor = mapBar.getToolTipColor();
    mapBar.getToolTip().setBackground(new PP.SolidColorBrush({
        Color: toolTipColor,
        Opacity: 0.5
    }));
    // Show the tooltip
    mapBar.toggleToolTip();
    if(!mapBar.getToolTip().getIsVisible()) {
        //mapBar.toggleToolTip();
    }
}
// Creates a bar factor
function createMapBar() {
    // Create a bar factor
    var mapBar = new PP.MapBar({
        Chart: map,
        Shape: getShape("RU-KYA"),
        MaxBarsCount: 6, // Maximum number of columns
        BorderThickness: 0.5, // Border thickness of columns
        Visual: createBarVisual(),
        Layer: getWorkLayer(), // Map layer
        LeastWidthPart: 10, // Minimum width of the column
        LeastHeightPart: 15, // Minimum height of the column
        IsPercentage: true, // Column value is percentage
        HideZeroHeight: true, // Columns with zero factor will be hidden
        ToolTip: createToolTip() // Tooltip
    });
    return mapBar;
}
// Renders the tooltip
function drawMapBar(mapBar) {
    mapBar.setSelectedIndex(getTimelineIndex());
    mapBar.getLayer().getMapBarCollection().push(mapBar);
    // Re-render a map
    map.draw();
}
// Shows information displaying in the tooltip
function printToolTipInfo(mapBar) {
    // Set the bar factor
    var bar1 = {};
    var barKey = "mapBar";
    bar1[barKey] = mapBar.getSettings();
    getWorkLayer().setBars(bar1);
    var bar2 = getWorkLayer().getBars()["mapBar"];
    console.log("Tooltip shows data of the 1%s area for the 2%s year",
        bar2.getShapeId(), bar2.getToolTipValues().TimelineStep);
}
// Create the bar factor
var mapBar = createMapBar();
// Render the factor
drawMapBar(mapBar);
// Show the tooltip
drawToolTip(mapBar);
// On year changing on time axis, refresh the tooltip
map.getTimeline().ValueChanged.add(function(sender, args) {
    // Hide the tooltip
    mapBar.toggleToolTip();
    mapBar.setSelectedIndex(getTimelineIndex());
    // Show the tooltip
    drawToolTip(mapBar);
});
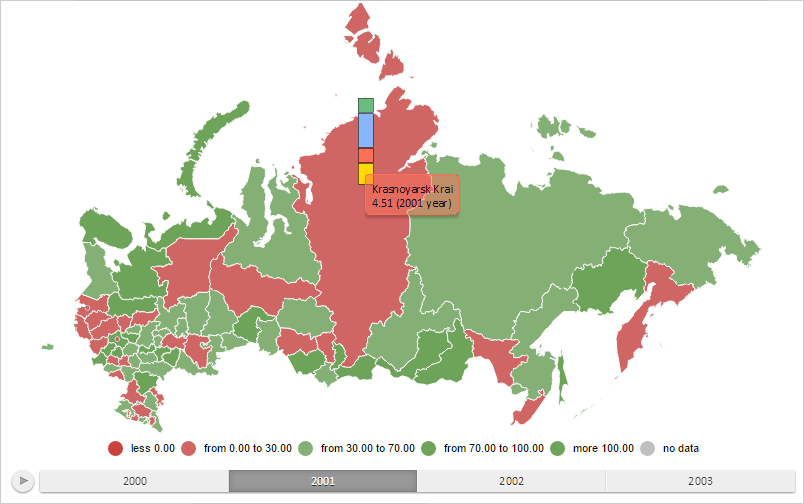
After executing the example, a bar factor for the map layer area with the RU-KYA ID and a tooltip for the ID were shown. Values of columns are in percents:
Now, determine information about data mapping settings for a bar factor:
printBarVisualInfo(mapBar);
After executing the string line, the browser console displays name of the principle data mapping, maximum number of lines for data mapping and data source ID for the first mapping:
Principle data mapping: BarHeightDataDependency
Maximum number of data mapping settings: 1
Data source identifier for the first data mapping: DataSource0
Then, play animation for a bar factor with duration equal to a half of the total playing time:
mapBar.animate(0.5, [mapBar.getAnimationType()]);
After executing the script string, the tooltip will be moved at several pixels up.
Determine the region and the year for which data is shown in the tooltip:
printToolTipInfo(mapBar);
After executing the example, the browser console displays the region ID and the year for which data is shown in the tooltip:
Tooltip shows data for the RU-KYA region for 2001
See also: