PP.AreaVisual(settings);
settings. JSON object that contains values of class properties.
The AreaVisual constructor creates an instance of the AreaVisual class.
To execute the example the HTML page must contain the MapChart component named map (see Example of Creating the MapChart Component). The map of the WebGL type should also be loaded, to do so it is necessary to execute the following script line:
changeMapType("WebGL");
Create and set a new object to work with data mapping settings for territory factor:
// Returns a layer with map areas
function getWorkLayer() {
    return map.getLayer("Regions");
}
// Returns a base class of the map territory factor
function getAreaVisual() {
    return getWorkLayer().getVisual();
}
// Returns information about territory factor
function printAreaVisualInfo(areaVisual) {
    console.log("Source identifier for the first data mapping: %s", areaVisual.getFirstDataSource().getId());
}
// Returns color
function getColorForValue(areaVisual, value) {
    // Get a scale to data mapping with fill colors of the map layer areas
    var scale = areaVisual.getColorMapping().getScale();
    var minIndex, maxIndex;
    var minValue, maxValue;
    for (var i = 0; i < scale.getValues().length; i++) {
        if (scale.getValues()[i] <= value) {
            minValue = scale.getValues()[i];
            minIndex = i;
        } else {
            maxValue = scale.getValues()[i];
            maxIndex = i;
            break;
        }
        if (i == scale.getValues().length - 1) {
            maxValue = scale.getValues()[i];
            maxIndex = i;
        }
    }
    var color = scale.between(minIndex, maxIndex, value / (maxValue - minValue));
    return color;
}
// Returns data source
function getDataSource() {
    return map.getDataSources().DataSource0;
}
/* Creates an object to work with data mapping settings
for the territory factor */
function createAreaVisual() {
    var areaVisual = new PP.AreaVisual({
        ColorMapping: getColorMapping(),
        HeightMapping: getHeightMapping()
    });
    return areaVisual;
}
// Creates settings of data mapping with fill color of the map layer areas
function getColorMapping() {
    var colorMappings = new PP.DataMapping({
        DataSource: getDataSource(),
        Type: PP.DataMappingType.Scale,
        DimAttributeId: "areaColor0",
        Id: "areaColor0",
        // Determine a scale
        Scale: new PP.ScaleBase({
            Items: "#FF705B #FF9191 #C3D66C #6BBC80 #82BAB6 Transparent",
            NoData: "Gray",
            TypeArguments: "Brush",
            Id: "MapScale0",
            Values: "0 30 70 100"
        })
    })
    return colorMappings;
}
// Creates settings of data mapping with height of the map layer areas
function getHeightMapping() {
    var colorMappings = new PP.DataMapping({
        DataSource: getDataSource(),
        Type: PP.DataMappingType.Scale,
        DimAttributeId: "areaHeight0",
        Id: "areaHeight0",
        // Determines a scale
        Scale: new PP.ScaleBase({
            Items: "11 23 57 69 85",
            NoData: "5",
            TypeArguments: "Double",
            Id: "scale0",
            Values: "15 40 60 75",
            ResultMode: PP.ScaleResultMode.IntervalsWithEquality
        })
    })
    return colorMappings;
}
// Refresh a legend
function updateLegend(visualId) {
    var visual = map.getVisualById(visualId);
    var legend = map.getLegendByDataMapping(visual ? visual.getColorMapping() : null);
    legend.setScale(visual.getColorMapping().getScale());
    var freeArea = new PP.Rect({
        Left: 0,
        Top: 0,
        Width: 800,
        Height: 460
    });
    // Re-draw the legend
    legend.draw(freeArea, getWorkLayer().getDomNode());
}
/* Set an object to work with data mapping settings
for the territory factor */
var areaVisual = createAreaVisual();
getWorkLayer().setVisual(areaVisual);
var visualId = "CustomAreaVisual";
map.addVisual(areaVisual, visualId);
// Re-draw the map
map.draw();
// Update the legend
updateLegend(visualId);
// Show information about territory factor
printAreaVisualInfo(areaVisual);
// Determine fill color of the map layer area with the 15 value
var value = 15;
var brush = getColorForValue(areaVisual, value);
if (brush) {
    console.log("Fill color for the map layer area with the %s value: %s", 15, brush.getColor());
} else {
    console.log("Color for the map layer area with the %s value is not determined", value);
}
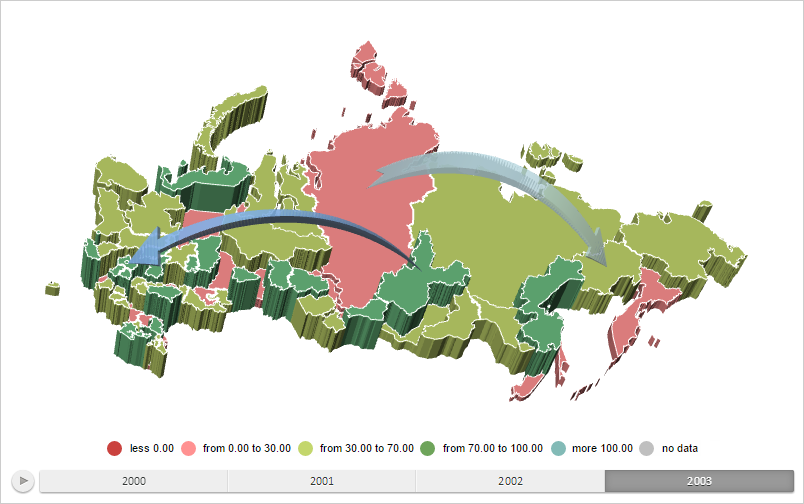
After executing the example, new settings of data mapping for territory factor were defined. As a result, map legend items are colored in other colors and the height of map layer areas is changed:
The browser console displays source identifier for the first data mapping of the territory factor and fill color for the map layer area with the 15 value:
Source identifier for the first data mapping: DataSource0
Fill color for the map layer area with the 15 value: #FF8076
See also: