To execute the example, create an HTML page and perform the following operations:
1. Add a link to the PP.css file. Also add links to the following JS files:
PP.js.
PP.Charts.js.
PP.GraphicsBase.js.
PP.Util.js.
resources.ru.js.
2. Then add a script that creates a cylinder in the <head> tag:
<script>
var cylinder;
function createCylinder() {
    // Create a cylinder
    cylinder = new PP.Ui.Cylinder({
        AnimationDuration: 4000, // Animation duration
        UseAnimation: false, // Animation is disabled
        ParentNode: document.body, // Root node
        // Cylinder flask and plot area sizes are not related
        IsRelativeDimensions: false,
        Width: 350, // Cylinder plot area width
        FlaskWidth: 130, // Cylinder flask width
        Height: 250, // Cylinder plot area height
        FlaskHeight: 170, // Cylinder flask height
        Orientation: PP.Orientation.Vertical,
        Loaded: function(sender, args) {
            console.log("Cylinder is loaded");
        }
    });
    // Draw cylinder
    cylinder.draw();
    // Rerender cylinder
    cylinder.redraw();
    // Create a cylinder axis
    this.createGaugeAxis();
    // Enable animation
    cylinder.setUseAnimation(true);
    // Set cylinder value
    this.createGaugeValue(7);
    cylinder._Values = [cylinder.getValue()];
    // Disable animation
    cylinder.setUseAnimation(false);
    // Create a trend line
    this.createTrendLine(5);
    // Create a cylinder header
    this.createCylindHeader();
    // Rerender cylinder values
    cylinder.redrawValues();
    // Create a frame for cylinder plot area
    this.createBorder();
}
// Creates a cylinder axis
var createGaugeAxis = function() {
    var axis = new PP.Ui.CylinderGaugeAxis({
        ParentCylinder: cylinder, // Parent cylinder
        MajorTicksCount: 6, // Number of major axis tick marks
        Width: 450, // Axis width
        Height: 250, // Axis height
        Min: 0, // Minimum axis value
        Max: 10, // Maximum axis value
        LabelStyle: new PP.Style(), // Tick mark style
        ValuesMode: PP.Ui.AxisValuesMode.MinMax, // Axis value dusplay mode
        Position: PP.LTRB.Right // Place axis at the right
    });
    // Set axis
    cylinder.setAxis(axis.getSettings());
    // Refresh cylinder axis style
    this.applyStyleForAxis(axis);
axis.setAxisUnits("cm");
// Move label to specify axis measurement unit
axis.getUnit().setLeft(axis.getUnit().getLeft() - 30);
// Refresh cylinder axis
this.updateAxis(axis);
}
// Refreshes cylinder axis
var updateAxis = function(axis) {
cylinder._Axis = axis;
}
// Returns axis values
var getAxisValues = function(minValue, maxValue, majorTicksCount) {
var values = [];
var step = Math.round((maxValue - minValue) / (majorTicksCount - 1));
for (var i = minValue; i <= maxValue; i += step) {
values.push(i + " cm");
}
return values;
}
// Apply style for cylinder axis
var applyStyleForAxis = function(axis) {
    // Create a style for axis tick marks
    var border = new PP.Border({
        Width: 1, // Tick mark width
    });
    // Create a style for major axis tick marks
    var majorTickStyle = {
        Border: border,
        Length: 20
    };
    // Create a style for minor axis tick marks
    var minorTickStyle = {
        Border: border,
        Length: 10
    };
    // Set style for major axis tick marks
    axis.setMajorTickStyle(majorTickStyle);
    // Set style for minor axis tick marks
    axis.setMinorTickStyle(minorTickStyle);
}
// Creates a trend line
var createTrendLine = function(value) {
    var trendLine = new PP.Ui.CylinderTrend({
        Color: new PP.Color(0, 0, 255), // Line color
        LabelStyle: {
            Text: value.toString() // Label
        },
        Label: null,
        Length: 300, // Line length
        ParentCylinder: cylinder, // Parent cylinder
        Value: value, // Value that corresponds to trend line
        Width: 1, // Line width
        LineStyle: PP.Ui.LineTypes.Dot // Line style
    });
    // Draw trend line
    trendLine.draw();
    trendLine.redraw();
    // Set trend line
    cylinder.setTrends([trendLine]);
    // Get label
    var label = cylinder.getTrends()[0].getLabel();
    if (label) {
        // Correct label position
        label.setPosition(label.getLeft() - 10, label.getTop());
    }
}
// Creates cylinder value
var createGaugeValue = function(value) {
    var gaugeValue = new PP.Ui.CylinderGaugeValue({
        Value: value, // Top cylinder base coordinate
        StartValue: 0, // Bottom cylinder base coordinate
        ParentAxis: cylinder.getAxis(), // Coordinate axis along the cylinder
        Fill: new PP.SolidColorBrush({
            Color: "#FF0000" // fill color of cylinder side surface
        }),
        UpFill: new PP.SolidColorBrush({
            Color: "#00FF00" // fill color of top cylinder base
        })
    });
    // Draw cylinder value
    gaugeValue.draw();
    gaugeValue.redraw();
    // Play trend line animation
    if (cylinder.getUseAnimation()) {
        objAnim = new PP.Ui.Animation({
            Duration: cylinder.getAnimationDuration(),
            Start: 0,
            End: value
        });
        objAnim.animateProp(gaugeValue, "Value");
    } else {
        gaugeValue.setValue(value);
    }
    // Set value
    cylinder.setValue(gaugeValue);
}
// Creates a cylinder header
var createCylindHeader = function() {
    var header = new PP.Ui.CylinderHeader({
            ParentCylinder: cylinder, // Cylinder, to which header belongs
            VerticalAlign: PP.VerticalAlignment.Top,
            HorizontalAlign: PP.HorizontalAlignment.Left,
            Font: new PP.Font({
                IsBold: true,
                Size: 18
            })
        })
        // Set header
    cylinder._Header = header;
    // Rerender header
    cylinder.getHeader().redraw();
    // Set header position
    cylinder.getHeader().setPosition(30, 0);
}
// Determines header shadow
var applyShadowForHeader = function(header) {
    var shadow = new PP.Shadow({
        Enabled: true,
        Color: new PP.Color(PP.Color.Colors.blue),
        Angle: 45,
        Size: 1,
        EnableBlur: true,
        EnableOpacity: true,
        BlurSize: 20,
        Distance: 10,
        Opacity: 0.5
    });
    header.setShadow(shadow);
}
// Creates a frame for cylinder plot area
var createBorder = function() {
    var rectElem = document.createElementNS("http://www.w3.org/2000/svg", "rect");
    rectElem.setAttributeNS(null, "width", cylinder.getWidth());
    rectElem.setAttributeNS(null, "height", cylinder.getHeight());
    rectElem.setAttributeNS(null, "stroke-width", 1);
    rectElem.setAttributeNS(null, "stroke", "rgb(195,195,195)");
    rectElem.setAttributeNS(null, "fill-opacity", 0);
    cylinder.getSVGNode().appendChild(rectElem);
}
</script>
3. In the <body> tag as the value of the onLoad attribute, specify name of the function for creating a cylinder:
<body onload="createCylinder()">
</body>
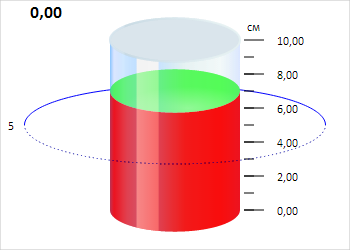
After executing the example the Cylinder component is placed on the HTML page:
The browser console also displays a message about loading the component:
Cylinder is loaded
See also: