To execute the example, create an HTML page and perform the following operations:
1. Add links to the following files: PP.css, PP.Express.css.
Also add links to the following JS files: PP.js, PP.Metabase.js, PP.Express.js, and resources.ru.js.
2. Then in the <head> tag add a script that creates express report dimension panel and table:
<script>
    var dimBar, eaxGrid, metabase, eaxAnalyzer, eaxMbService;
    function Ready() {
        // Create repository connection
        metabase = new PP.Mb.Metabase({
            ExportUrl: "PPService.axd?action=export",
            ImportUrl: "PPService.axd?action=import",
            PPServiceUrl: "PPService.axd?action=proxy",
            Id: "WAREHOUSE",
            UserCreds: {
                UserName: "user",
                Password: "password"
            }
        });
        // Open repository connection
        metabase.open();
        // Create a service for working with express reports
        eaxMbService = new PP.Exp.EaxMdService({
            Metabase: metabase
        });
        // Open express report with the 109 key
        eaxAnalyzer = eaxMbService.editDocument(109);
        // Create a component for working with OLAP dimension panel
        dimBar = new PP.Exp.Ui.EaxDimBar({
            ParentNode: "dimBar",
            Source: eaxAnalyzer, // Set data source
            EnableDragDim: true, // Enable dimension moving
            ImagePath: "../../build/img/",
            Width: 400,
            Height: 400,
            Service: eaxMbService,
            // Handle report change event
            MetadataChanged: function (sender, args) {
                eaxGrid.refresh(args); // On changing report refresh data table
            }
        });
        // Create a data table
        eaxGrid = new PP.Exp.Ui.EaxGrid({
            Source: eaxAnalyzer, // Set data source
            ParentNode: "divTable",
            Id: "table1",
            EditMode: false,
            Width: 500,
            Height: 400,
            Service: eaxMbService,
            AutoSendSelection: true
        });
    }
</script>
3. In the <body> tag as the value of the onLoad attribute specify name of the function that is used to create express report working area, and add blocks with the dimBar and divTable identifiers:
  <body onselectstart="return false" onload="Ready()">
      <table>
          <tbody>
              <tr>
                  <td style='vertical-align: top'>
                      <div id="dimBar">
                      </div>
                  </td>
                  <td>
                      <div id="divTable">
                      </div>
                  </td>
                  <td>
                      <div id="divChart">
                      </div>
                  </td>
              </tr>
          </tbody>
      </table>
    </body>
4. At the end of the document insert a code that sets styles corresponding to client's operating system, to the document.body node:
<script type="text/javascript">
    PP.initOS(document.body);
</script>
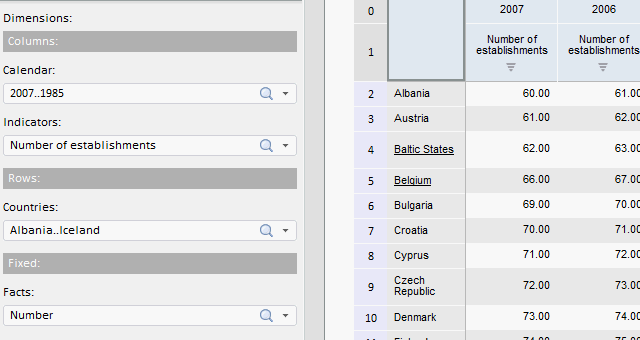
After executing the example the EaxDimBar and EaxGrid components are placed on the HTML page:
See also: