To execute the example, create an HTML page and execute the following operations:
1. Add links to the following files: PP.css, PP.Express.css.
Also add links to the following JS files: PP.js, PP.Metabase.js, PP.Express.js, resources.ru.js, Silverlight.js.
2. Place the script that creates an express report bubble chart and a bubble chart setup wizard:
<script type="text/javascript">
    var metabase, eaxMbService, eaxBubbleChart, bubbleChartMaster, waiter, eaxAnalyzer;
    function Ready() {
        // Determine language settings for resources
        PP.setCurrentCulture(PP.Cultures.ru);
        // Specify path to the root folder containing resources files
        PP.resourceManager.setRootResourcesFolder("../resources/");
        waiter = new PP.Ui.Waiter();
        // Create repository connection
        metabase = new PP.Mb.Metabase({
            PPServiceUrl: "PPService.axd?action=proxy",
            Id: "WAREHOUSE",
            UserCreds: {
                UserName: "user",
                Password: "password"
            },
            StartRequest: function () {
                // On requesting metadata show component of the PP.Ui.Waiter type
                waiter.show();
            },
            EndRequest: function () {
                // After requesting metadata hide component of the PP.Ui.Waiter type
                waiter.hide();
            },
            Error: function (sender, args) {
                // In case of error display error description
                alert(args.ResponseText);
            }
        });
        // Open repository connection
        metabase.open();
        // Create a service for working with express reports
        eaxMbService = new PP.Exp.EaxMdService({
            Metabase: metabase
        });
        // Open express report with the 108 key for edit
        eaxAnalyzer = eaxMbService.openDocument(108);
    };
    // Function for creating express report bubble chart wizard
    function createEaxBubbleChart() {
        eaxBubbleChart = new PP.Exp.Ui.EaxBubbleChart({
            Source: eaxAnalyzer,
            Service: eaxMbService,
            ImagePath: "../build/img/",
            ParentNode: "bubbleChart"
        });
        // Set bubble chart size
        eaxBubbleChart.setSize(300, 500);
    };
    // Function for creating of express report bubble chart wizard
    function showBubbleChartMaster() {
        bubbleChartMaster = new PP.Exp.Ui.BubbleChartMaster({
            ImagePath: "../build/img/",
            DataView: eaxBubbleChart,
            ParentNode: "bubbleChartMaster"
        });
        // Set data source
        bubbleChartMaster.setSource(eaxAnalyzer);
        // Set wizard size
        bubbleChartMaster.setSize(300, 500);
    };
</script>
3. Within the <body> tag as the value of the onLoad attribute, specify name of the function that loads express report document, bubble chart and properties panel:
<body onselectstart="return False" onload="Ready()">
    <div>
        <!-- Button clicking which displays express report bubble chart -->
        <input type="button" value="Display express report bubble chart" onclick="createEaxBubbleChart()" />
        <!-- Button clicking which express report bubble chart wizard -->
        <input type="button" value="Display bubble chart wizard" onclick="showBubbleChartMaster()" />
    </div>
    <div id="bubbleChart" style="float: left;">
    </div>
    <div id="bubbleChartMaster" style="float: left;">
    </div>
</body>
4. At the end of the document insert code that sets styles corresponding to client's OS to the document.body node:
<script type="text/javascript">
    PP.initOS(document.body);
</script>
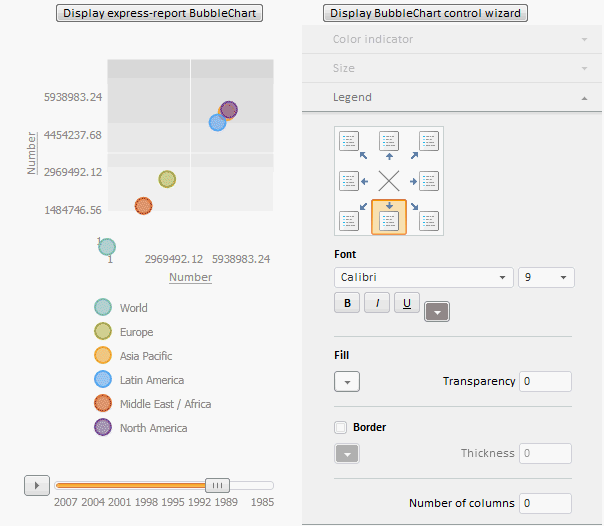
After executing the example two buttons are added on the HTML page, clicking this buttons creates the PP.Exp.Ui.EaxBubbleChart and PP.Exp.Ui.EaxBubbleChartMaster components respectively:
See also:
EaxBubbleChart | BubbleChartMaster