To execute the example, create an HTML page and execute the following operations:
1. Add links to the following files: PP.css, PP.Express.css.
Also add links to the following JS files: PP.js, PP.Metabase.js, PP.Express.js, resources.ru.js, Silverlight.js.
2. Place the script that creates an express report bubble chart and a properties panel:
<script type="text/javascript">
    var metabase, eaxMdService, eaxBubbleChart;
    function Ready() {
        PP.ImagePath = "../build/img/"; // Path to images folder
        PP.ScriptPath = "../build/"; // Path to scenarios folder
        PP.CSSPath = "../build/"; // Path to styles folder
        // Specify path to the root folder containing resources files
        PP.resourceManager.setRootResourcesFolder("../resources/");
        // Determine regional settings
        PP.setCurrentCulture(PP.Cultures.ru)
        var waiter = new PP.Ui.Waiter();
        // Create repository connection
        metabase = new PP.Mb.Metabase({
            PPServiceUrl: "PPService.axd?action=proxy",
            Id: "WAREHOUSE",
            UserCreds: {
                UserName: "user",
                Password: "password"
            },
            StartRequest: function () {
                // On metadata query, display component of the PP.Ui.Waiter type
                waiter.show();
            },
            EndRequest: function () {
                // After metadata query hide component of the PP.Ui.Waiter type
                waiter.hide();
                // Get this wizard
                var master = eaxPropBar.getBubbleChartMaster();
                // Display and expand first wizard panel
                master.getItems()[0].show();
                master.getItems()[0].expand();
            },
            Error: function (sender, args) {
                // in case of error display error description
                alert(args.ResponseText);
            }
        });
        // Open repository connection
        metabase.open();
        // Create a service for working with express reports
        eaxMdService = new PP.Exp.EaxMdService({
            Metabase: metabase
        });
        // Open express report with the 7390 key for edit
        eaxAnalyzer = eaxMdService.openDocument(7390);
        // Create a bubble tree of express report
        eaxBubbleChart = new PP.Exp.Ui.EaxBubbleChart({
            Source: eaxAnalyzer, // Data source
            Service: eaxMdService,
            Width: 400,
            Height: 400,
            ParentNode: "bubbleChart"
        });
        // Create express report properties panel
        eaxPropBar = new PP.Exp.Ui.EaxPropertyBar({
            ParentNode: "propertyBar",
            Source: eaxAnalyzer, // Data source
            Width: 300,
            Height: 400,
            Service: eaxMdService,
            DataView: eaxBubbleChart // Link properties panel to bubble tree
        });
        // Display map wizard
        eaxPropBar.showBubbleChartMaster();
    };
</script>
3. Within the <body> tag as the value of the onLoad attribute, specify name of the function that loads express report document, bubble chart and properties panel. Within the tag place blocks that will store this panel and bubble chart container:
<body onload="Ready()">
    <div id="propertyBar" style="float: left;">
    </div>
    <div id="bubbleChart" style="float: left;">
    </div>
</body>
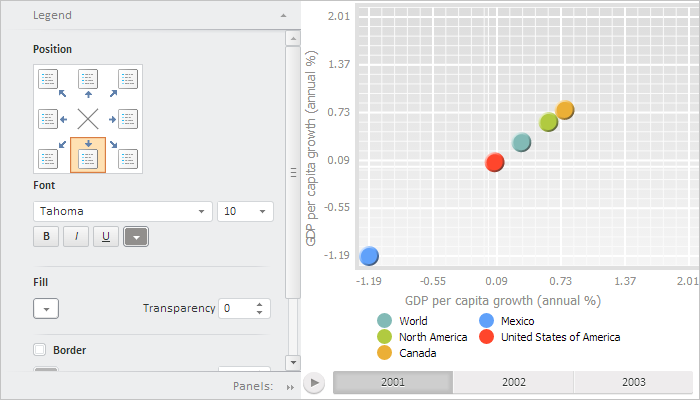
After executing the example the PP.Exp.Ui.EaxPropertyBar and PP.Exp.Ui.EaxBubbleChart components will be placed on the HTML page:
See also:
EaxBubbleChart | EaxPropertyBar