To execute the example, create an HTML page and execute the following operations:
1. Add links to the following files: PP.css, PP.Express.css.
Also add links to the following JS files: PP.js, PP.Metabase.js, PP.Express.js, and resources.ru.js.
2. Then in the <head> tag add a script that creates express report properties panel and chart:
    PP.ImagePath = "../build/img/"; // Path to images folder
    PP.ScriptPath = "../build/"; // Path to scenarios folder
    PP.CSSPath = "../build/"; // Path to styles folder
    var eaxPropBar, chartBox;
    // Specify path to the root folder containing resources files
    PP.resourceManager.setRootResourcesFolder("../resources/");
    // Determine regional settings
    PP.setCurrentCulture(PP.Cultures.ru);
    function Ready() {
var waiter = new PP.Ui.Waiter();
// Create a repository connection
metabase = new PP.Mb.Metabase({
PPServiceUrl: "PPService.axd?action=proxy",
Id: "WAREHOUSE",
UserCreds: {
UserName: "user",
Password: "password"
},
StartRequest: function () {
                // On metadata request, show component of the PP.Ui.Waiter type
                waiter.show();
            },
            EndRequest: function () {
                // After metadat request, hide component of the PP.Ui.Waiter type
                waiter.hide();
            },
            Error: function (sender, args) {
                // In case of error, display error description
                alert(args.ResponseText);
            }
        });
        // Open repository connection
        metabase.open();
        // Create a service used to work with express reports
        eaxMdService = new PP.Exp.EaxMdService({
            Metabase: metabase
        });
        // Open express report with the 4369 key for edit
        eaxAnalyzer = eaxMdService.openDocument(4369);
        // Create a chart
        chartBox = new PP.Exp.Ui.ChartBox({
            Source: eaxAnalyzer, // Data source
            ParentNode: "chartBox",
            Service: eaxMdService, // Service
            EditMode: PP.Exp.Ui.ChartEditMode.Point, // Pointwise editing
            Width: 400,
            Height: 400,
            SelectionEnabled: true, // Selection is available
            ShowLoadConfirm: true, // Display message on exceeding of the maximum number of chart points
            LoadConfirmThreshold: 1000 // Maximum number of chart points
        });
        // Create express report properties panel
        eaxPropBar = new PP.Exp.Ui.EaxPropertyBar({
            ParentNode: "propertyBar",
            Source: eaxAnalyzer, // Data source
            Width: 300,
            Height: 400,
            Service: eaxMdService,
            DimViewMode: PP.Exp.Ui.DimViewMode.Classic,
            DataView: chartBox // Bind properties panel to chart
        });
        // Display chart setup wizard
        eaxPropBar.showChartMaster(PP.Exp.Ui.PropertyGroups.Chart)
    };
3. In the <body> tag specify name of the function that creates express report properties panel and chart as value of the onLoad attribute, and also add here the blocks with the identifiers propertyBar and chartBox:
<body onload="Ready()">
    <!-- Side panel -->
    <div id="propertyBar" style="float: left;"></div>
    <!-- Chart -->
    <div id="chartBox" style="float: left"></div>
</body>
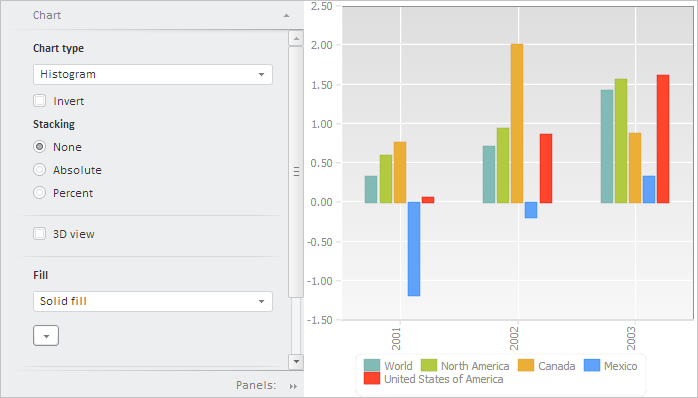
After executing the example the HTML page will contain the PP.Exp.Ui.EaxPropertyBar and ChartBox components:
See also: