setChartDataSource(report: PP.Exp.EaxAnalyzer, metadata: EaxInteractiveMode, callback);
report. Express report that includes the chart for which the user sets data source.
metadata. Object that stores settings.
callback. Callback function.
The setChartDataSource method sets a data source for express report chart.
Executing the example requires that the HTML page contains the ExpressBox component named expressBox (see Example of Creating the ExpressBox Component), and a chart must be loaded in express report working area. Set a chart data source that will depend on selection in the table:
// Get service for working with express report
var eaxMdService = expressBox.getService();
// Get express report document
var eaxAnalyzer = expressBox.getSource();
// Determine metadata
var metadata = expressBox.getRibbonView().getChartCategory().getChartDataSourceState();
// Use table selection
metadata.useGridSelection = true;
// Determine callback function arguments
var args = new PP.Mb.Ui.PropertyChangedEventArgs({
    PropertyName: PP.Exp.Ui.ControlType.DataSources,
    Metadata: metadata,
    TypeUpdateData: [PP.Exp.Ui.ViewTypeUpdate.Chart]
});
// Determine callback function
var onPanelChanged = function (n, t) {
    var chartView = expressBox.getDataView().getChartView();
    t.Args ? (chartView.DataChanged.fire(chartView, t.Args), t.Args.fireCallback(n, t)) : chartView.DataChanged.fire(chartView, t);
    t.Args && t.Args.getPropertyName() == PP.Exp.Ui.ControlType.DataSources && chartView.refreshAll();
    console.log("Express report chart data source is set.");
};
// Set express report chart data source
eaxMdService.setChartDataSource(eaxAnalyzer, metadata, PP.Delegate(onPanelChanged, eaxMdService, args));
Executing the example sets for express report chart a data source that depends on table selection, and outputs an appropriate message to the browser console.
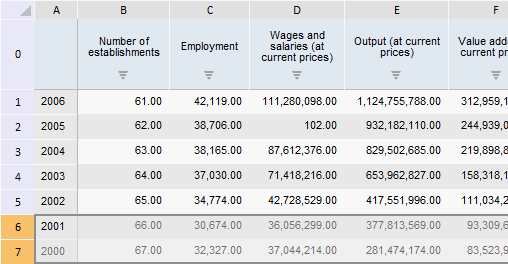
Select rows corresponding to 2001 and 2002 years in the express report table:
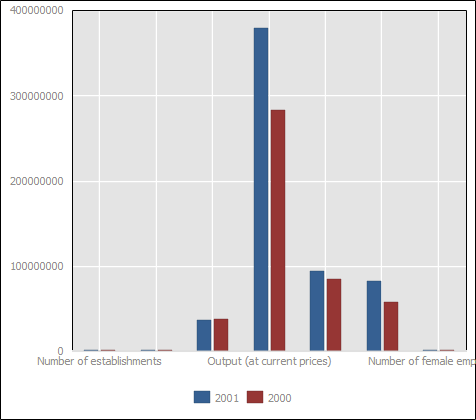
After executing the example the express report chart shows only data for selected years: 2001 and 2002:
See also: