setPointValue(value: Number, serie: Number, point: Number, fireEvent);
value. Assigned value.
serie. Determines the chart series that includes the chart point.
point. Indicates a point in the specified series.
fireEvent. Parameter that determines whether to fire an appropriate event after method execution. By default it is set to True. If this parameter is set to False, no event occurs.
The setPointValue method sets a value for a specified express report chart point.
Executing the example requires that the HTML page contains the ExpressBox component named expressBox (see Example of Creating the ExpressBox Component), and a chart must be loaded in express report working area. Set a value for a specified chart point:
// Get express report chart view
var chartView = expressBox.getDataView().getChartView();
// Set value for express report chart point
var serie = 3; // Chart series
var point = 0; // Value in the specified series
chartView.setPointValue(150, serie, point, true);
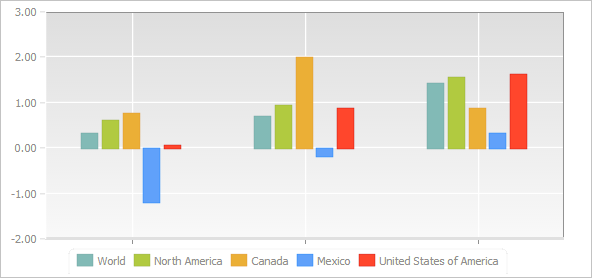
Before executing the example the express report chart looked as follows:
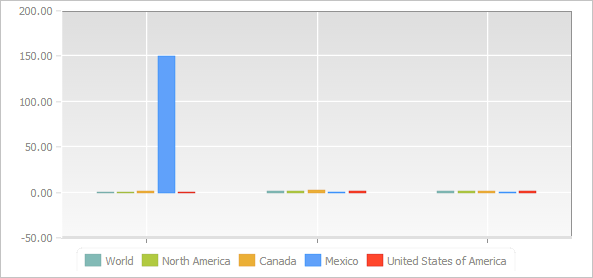
After executing the example a new value is set as the first value of the fourth data series in the chart:
Then roll back the changes:
chartView.undoData();
After executing this code line the express report chart returns to its initial appearance. If the chart is refreshed it changes in the same way:
chartView.refresh();
See also: