LegendPosition: String;
The LegendPosition property determines position of chart legend.
Use the setLegendPosition method to set the property value, and the getLegendPosition method to get the property value. Property value cannot be set from JSON.
This property may have the following string values: bottom or top - legend position at the top or at the bottom of the chart plot area, left or right - alignment to the left or to the right edge. These values can be combined using the splitter |.
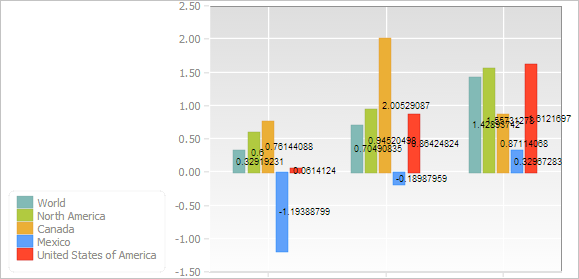
Executing the example requires that the HTML page contains the ExpressBox component named expressBox (see Example of Creating the ExpressBox Component), and a chart must be loaded in the data area. Place the legend at the left below the chart plot area and show data series labels:
// Get container with the express report chart
var chartView = expressBox.getDataView().getChartView();
// Place map legend at the left below the chart plot area
chartView.setLegendPosition("bottom|left");
// Show series labels
chartView.setSignaturesOptions("%Autovalue", "custom", True);
After executing the example the legend is placed at the left below the chart plot area, and data series labels are displayed:

See also: