ChartType: Object|String
The ChartType property sets and gets type of express report chart.
Use the setChartType method to set the property value, and the getChartType method to get the property value. Property value cannot be set from JSON.
The setChartType method takes a string as a parameter. The getChartType method has a parameter asString; when this parameter is True, a string is returned, otherwise an object with the following fields is returned: Inverted - chart display mode from top to bottom or from left to right, Stacking - method of accumulating chart values, Type - chart type.
To specify type of and express report chart, use values line, column, pie, area, or scatter, when necessary, add the | symbol and specify Inverted, StackedA, or StackedP values.
Executing the example requires that the HTML page contains the ExpressBox component named expressBox (see Example of Creating the ExpressBox Component) and have a loaded chart in working area of the express report. Convert an initial histogram to a pie chart:
// Get view of the express report chart
var chartView = expressBox.getDataView().getChartView();
// Change the chart type
chartView.setChartType("pie");
// Refresh the express report chart
chartView.refreshAll();
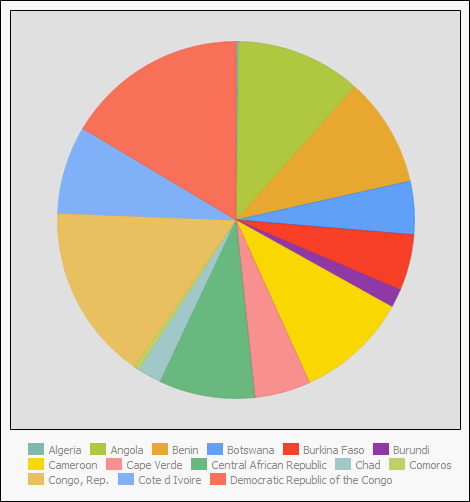
After executing the example a histogram is converted into a pie chart:

See also: