animateGraph(step: Number);
step. Animation step. Can be set from 0 to 1.
The animateGraph method renders minor animation step of data series.
If the step parameter is set to 0, data series chart is shown in the animation beginning, if it is set to 1 - at the end.
Executing the example requires that the page contains the RatingChart component named ratingChart (see Example of Creating the RatingChart Component). Go to the second step of time line, after it display position change animation and graphic of the first data series:
// Get timeline
time = ratingChart.getTimeline();
// Specify the second step of timeline as the current one
time.setCurrentStep(1);
function animate(){
console.log("Waited until timeline step change animation finished");
// Get the first data series
serie = ratingChart.getSerie(0);
// Display certain animation step of data series graph change
serie.animateGraph(0.8);
// Display certain step of data series position change animation
serie.animatePosition(0.8);}
// Start function with delay required to display timeline step change display animation
setTimeout(animate, 3000)
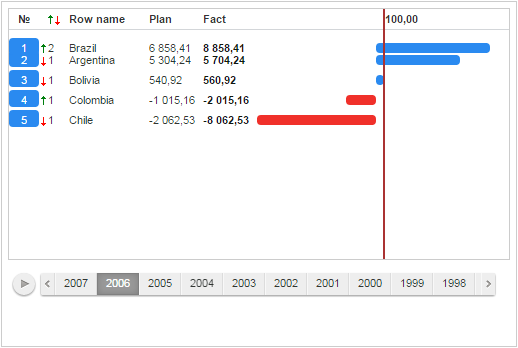
After executing the example the rating chart looks as follows:
See also: