getSelection(): Array of PP.Ui.RatingChartSerie;
The getSelection method returns array of selected data series.
To execute the example, the HTML page must contain the RatingChart component named ratingChart (see Example of Creating the RatingChart Component). Handle the SelectionStart and Selected events to color all selected data series to yellow:
// Enable multiple selection in chart
ratingChart.AllowMultipleSelection = true;
// Get data series
var series = ratingChart.getSeries();
// Determine style by default
var defaultStyle = {
    Index: ratingChart._DefaultIndexStyle,
    Line: ratingChart._DefaultLineStyle,
    NegativeLine: ratingChart._DefaultNegLineStyle
};
// Determine new view style for selected data series
var selectedStyle = {
    /* Set fill color for tick marks with series indexes */
    Index: new PP.SolidColorBrush({
        Color: PP.Color.Colors.yellow
    }),
    /* Set fill color for rating columns */
    Line: new PP.SolidColorBrush({
        Color: PP.Color.Colors.yellow // Yellow color
    }),
    /* Set fill color for rating columns
       place only to the left of the trend line */
    NegativeLine: new PP.SolidColorBrush({
        Color: PP.Color.Colors.orange
    })
};
// Handle the SelectionStart event
ratingChart.SelectionStart.add(function (sender, args) {
    // Set new style for selecting series
    ratingChart.setStyle(args.LineIndex, selectedStyle);
});
//Handle the Selected event
ratingChart.Selected.add(function (sender, args) {
    // Cycle by all sorted data series
    for (var i = 0; i < series.length; i++) {
        // Apply first default style
        ratingChart.setStyleToSerie(i, defaultStyle);
        // Get current series
        var currentSerie = ratingChart.getSerie(i);
        var selection = ratingChart.getSelection();
        // Get name of the selected series
        for (var j = 0; j < selection.length; j++) {
            // Cycle by all selected chart series
            var counter = 0; // Counter
            var selectedSerieName = "";
            for (var k in series) { // Cycle by all series
                if (counter == selection[j]) {
                    selectedSerieName = series[k].Name;
                }
                counter++;
            };
            if (currentSerie.Name == selectedSerieName) {
                //  Set new style for selected series
                ratingChart.setStyle(i, selectedStyle);
            }
        };
    };
});
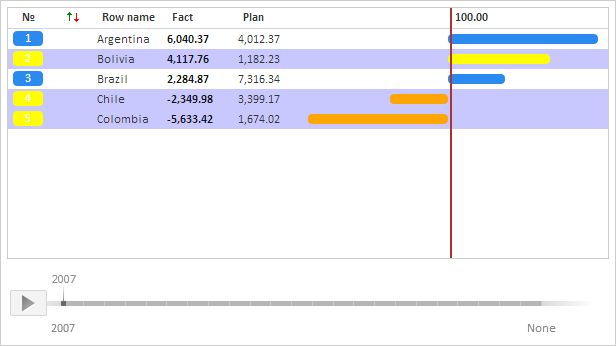
After executing the example all selected data series will be colored in yellow. The rating columns positioned to the left of the trend line will have orange fill after selection. If the second, fourth and fifth series are selected, the rating chart looks as follows:
See also: