The chart with changeable sector radius has two available metrics:
Sector angle is a metric set in the EaxRadiusAngleChartView.Props property and determined by one of the columns settings.
Sector radius is a standard metric of a pie chart.
Executing the example requires the kapBox component (see Example of the KapBox Component Layout). The repository must contain an express report set up on the chart view containing several columns.
Improve creation code of the kapBox component, before the line of the component creation:
kapBox = new Kap.KapBox ...
Add registration code of the plugin set for the first column:
Kap.regPluginBlock({
      Id: "RadiusAngleChart",
      Name: "RadiusAngleChart",
      View: "PP.Exp.Ui.EaxRadiusAngleChartView",
      SourceClass: PP.App.ModuleType.Olap,
      Js: "../build/PP.RadiusAngleChartPlugin.js",
      Props: {
          pluginProps: { AnglePointIndex: "0" }
      }
});
In this case a plugin can be added to dashboard.
To add plugin, use the ![]() Plugin button on the Insert ribbon tab.
Plugin button on the Insert ribbon tab.
After adding the plugin select chart data source: express report with configured chart.
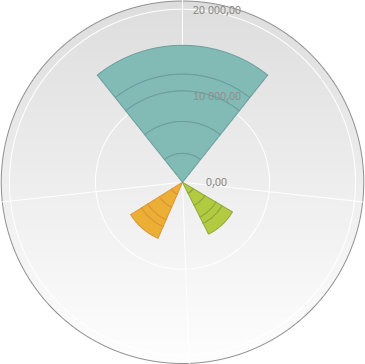
After executing the example the chart using the first column as angle factor is created, the first column is also used to display radius, which was not hidden by the AnglePointVisible property.
To access properties of created block, it is necessary to get block instance. Hide column used as sector angle:
props = block.getProps();
props.AnglePointVisible = false;
block.setProps(props);
After executing the code, the first column will not be displayed in radius factors because it is used in the angle factor.
See also: