loadData(data: Object);
data. Loaded data.
The loadData method uploads specified data to chart.
The parameter is the data shown as the following JSON object: {<data source ID>: <data source settings object>}.
To execute the example, the HTML page must contain the BubbleChart component named bubbleChart (see Example of Creating the BubbleChart Component). Specify new data for the series with the index 1:
// Specify new data for the series with the index 1
var dataSource = {
    "ds0": {
        "LoadedIndexes": [0, 1, 2, 3, 4, 5, 6],
        "Series": {
            "Serie1_Point0": {
                // Data on the X axis
                "DimX": {
                    "Items": ["150000", "160000", "170000", "180000", "190000", "200000", "NULL"]
                },
                // Data on the Y axis
                "DimY": {
                    "Items": ["10", "11", "12", "13", "14", "15", "16"]
                },
                // Dta displaying on the bubbles size of the bubble chart
                "DimR": {
                    "Items": ["50000", "51000", "52000", "53000", "54000", "55000", "56000"]
                },
                // Data displaying to the bubbles color of the bubble chart
                "DimCol": {
                    "Items": ["12000", "12500", "13500", "14000", "14500", "15000", "15500"]
                }
            }
        }
    }
}
// Load additional data
bubbleChart.loadData(dataSource);
// Re-render the bubble chart
bubbleChart.draw()
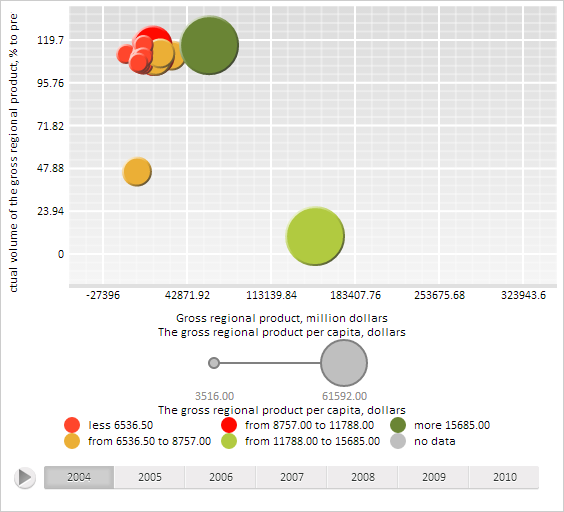
As a result of example executing, new data is specified for the series with index 1, and the bubble chart appearance has been changed:
See also: