Visuals: Object
The Visuals property sets and gets settings of mapping data series values with chart axes, color and size of chart elements.
Use JSON or the setVisuals method to set the property value, and the getVisuals method to get the property value.
The property contains a JSON object with the following fields of the PP.CoordinateVisual type: X, Y, R and Color.
To execute the example, the HTML page must contain the BubbleChart component named bubbleChart (see Example of Creating the BubbleChart Component). Change colors array for the scale of bubble chart data mapping:
// Determine colors array
var colorScale = new PP.ScaleBase({
    Items: "#00ff00 #30cf00 #708f00 #b04f00 #f00f00",
    NoData: "#AFBFBF",
    TypeArguments: "Brush"
});
// Get settings of data mapping
var visuals = bubbleChart.getVisuals();
// Get get a set of bubble chart scale colors
var colorItems = visuals.Color.getColorMapping().getScale().getItems();
// Change scale colors
for (var i in colorItems) {
    colorItems[i].setColor(colorScale.getItems()[i].getColor());
};
// Determine settings of data mapping
bubbleChart.setVisuals(visuals);
// Refresh bubble chart
bubbleChart.refresh();
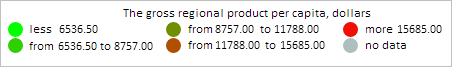
As a result of executing the example, bubble colors in the scale of bubble chart data mapping are changed:
See also: