Before executing the example study recommendations for code writing. Make sure that the repository contains a regular report with the 11775 key.
To create the GridBox component, use the HTML code:
<!DOCTYPE html PUBLIC "-//W3C//DTD XHTML 1.0 Transitional//EN" "http://www.w3.org/TR/xhtml1/DTD/xhtml1-transitional.dtd">
<html>
<head>
    <title>GridBox</title>
    <script src="../build/PP.js" type="text/javascript"></script>
    <link href="../build/PP.css" type="text/css" rel="stylesheet" />
    <script src="../build/PP.Metabase.js" type="text/javascript"></script>
    <script src="../build/PP.TabSheet.js" type="text/javascript"></script>
    <script src="../build/PP.Report.js" type="text/javascript"></script>

    <script type="text/javascript">
        var prxReport, prxMbService, grid;
        function viewGrid()
        {
            PP.ImagePath = "../build/img/";
            PP.ScriptPath = "../build/";
            // Set up repository connection
            metabase = new PP.Mb.Metabase({
                // Set PP.SOM web service URL in the format:
                // <http://<ServerName | IP-address>[:<Port>][/<VirtualCatalog>]/axis2/services/PP.SOM.Som>
                PPServiceUrl: "http://localhost/FPBI_App_v10.x/axis2/services/PP.SOM.Som",
                // Specify repository identifier and credentials
                Id: "Repository",
                UserCreds: {
                    UserName: "user",
                    Password: "password"
                },
            });
            // Open repository connection
            metabase.open();
            // Create a service for working with regular report
            prxMbService = new PP.Prx.PrxMdService({ Metabase: metabase });
            // Open regular report with the 11775 key
            prxReport = prxMbService.open(11775);
            // Create a table sheet
            grid = new PP.Prx.Ui.GridBox({
                Source: prxReport,
                ParentNode: document.body,
                Width: 1100,
                Height: 700,
                Service: prxMbService
            });
        };
    </script>
</head>
<body onload="viewGrid()">
</body>
</html>
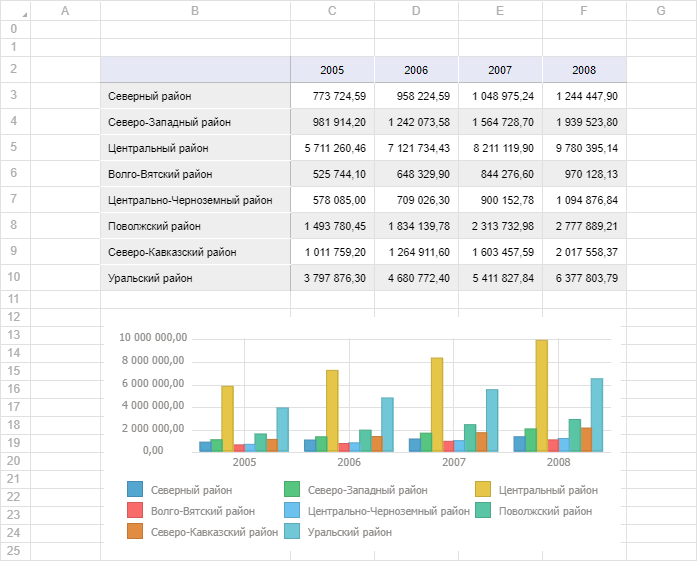
After executing the example, the HTML page will house the GridBox component with a regular report table sheet:

It is available to change table cell values in the table sheet. Charts and maps are displayed as images and cannot be edited.
See also: