To execute the example, create an HTML page and execute the following operations:
1. Add links to the following files: PP.css, PP.Express.css.
Also add links to the following JS files: PP.js, PP.Metabase.js, PP.Express.js, and resources.ru.js.
2. Then in the <head> tag add a script that creates dimension selection wizard, express report table and chart:
        var dimBarMaster, eaxGrid, metabase, eaxAnalyzer, eaxMbService, eaxChart;
        function Ready() {
            //Set resources folder
            PP.resourceManager.setRootResourcesFolder("../resources/");
            // Determine language settings for resources
            PP.setCurrentCulture(PP.Cultures.ru);
            // Create repository connection
            metabase = new PP.Mb.Metabase({
                ExportUrl: "PPService.axd?action=export",
                ImportUrl: "PPService.axd?action=import",
                PPServiceUrl: "PPService.axd?action=proxy",
                Id: "WAREHOUSE",
                UserCreds: {
                    UserName: "user",
                    Password: "password"
                }
            });
            // Open repository connection
            metabase.open();
            // Create a service for working with express reports
            eaxMbService = new PP.Exp.EaxMdService({
                Metabase: metabase
            });
            // Open express report with the 109 key
            eaxAnalyzer = eaxMbService.editDocument(109);
            // Create a wizard containing EaxDimBarMasterPanel panels,
            // table and chart for displaying data
            dimBarMaster = new PP.Exp.Ui.EaxDimBarMaster({
                ParentNode: "dimBar",
                Width: 300,
                Height: 500,
                Source: eaxAnalyzer, // Determine data source
                ImagePath: "../build/img/", // Path to icons folder
                Service: eaxMbService,
                MetadataChanged: function (sender, args) {
                    console.log(dimBarMaster.getMode());
                }
            });
            eaxGrid = new PP.Exp.Ui.EaxGrid({
                Source: eaxAnalyzer,
                ParentNode: "divTable",
                EditMode: false,
                ImagePath: "../build/img/", // Path to icons folder
                Width: 300,
                Height: 500,
                Service: eaxMbService,
                AutoSendSelection: true
            });
            eaxChart = new PP.Exp.Ui.ChartBox({
                Source: eaxAnalyzer,
                ParentNode: "divChart",
                ImagePath: "../build/img/", // Path to icons folder
                Width: 500,
                Height: 400,
                Service: eaxMbService
            });
            dimBarMaster.setDataView([eaxGrid, eaxChart]);
        }
3. In the <body> tag as the value of the onLoad attribute specify name of the function that is used to create express report working area, and add blocks with the dimBar and divTable identifiers:
  <body onselectstart="return false" onload="Ready()">
      <table>
          <tbody>
              <tr>
                  <td style='vertical-align: top'>
                      <div id="dimBar">
                      </div>
                  </td>
                  <td>
                      <div id="divTable">
                      </div>
                  </td>
                  <td>
                      <div id="divChart">
                      </div>
                  </td>
              </tr>
          </tbody>
      </table>
    </body>
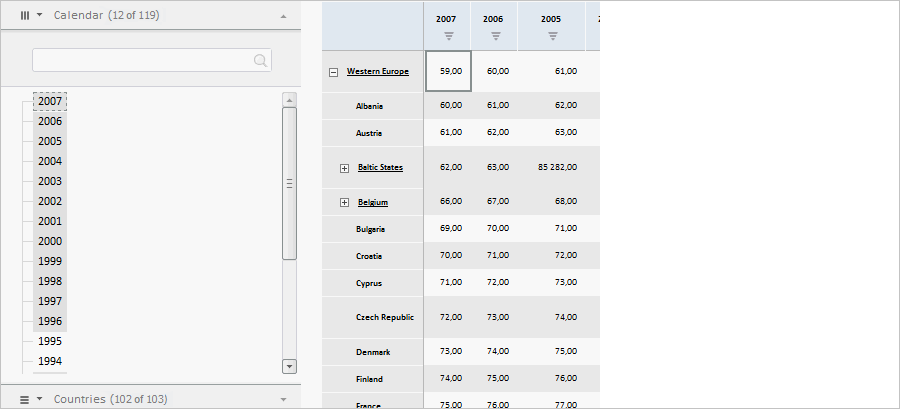
After executing the example the HTML page will contain the EaxDimBarMaster, EaxGrid and ChartBox components:
On refreshing report metadata, the browser console displays type of the first data view, which selection is set up in the wizard (Grid).
See also: